The repurposing of digital media and data for social research is a challenging activity that comes with some extra efforts because using digital methods is not about enquiring technologies from the outside in (see Marres, 2017), but about understanding, how to work with socio-technical assemblages and how to think along with a network of methods.
This post exposes what extra efforts mean in practical terms and when using digital methods. My reflections are particularly based on the context of a data journalism workshop at King’s College London, also a good example of the demands required when teaching digital methods online.
The workshop aimed to investigate cultures of climate denial with the Desmog database and it proposed to combine teaching, research and civic engagement; which is an engaged research-led teaching project led by Liliana Bounegru and Jonathan Gray. Together with them, and for two months early this year, Thais Matias and I contributed to this project as workshop facilitators. The teaching strategy adopted is one of my favourites; the flipped-classroom approach where students should:
- prepare before they attend the classes and,
- in the classroom, they apply some key concepts and methods previously learnt (with the help of worksheet references and methods recipes),
- while extending their learning out of the classroom.
This blended learning proposal is closely related to a student-based pedagogy offered by problem-based learning (PBL) originally developed for medical education but expanded to other fields of study. Both the PBL and the flipped-classroom approaches fit well with the type of (research) practice proposed by digital methods. For instance, when invoking researchers to spend some time in list-making for data collection and treatment, and to develop technical skills and more technical modes of thinking. This is ironic somehow, because, when it comes to online data and considering how simple the data extraction can be, scholars are often more eager to jump to data exploration and visualisation, rather than trying to make sense, in practice, of the role of a good query design, learning how to question the list of entry points (e.g. hashtags, accounts, URLs) taken to data collection. In this post, I want to state that such extra efforts and dedicated time are part of the research process and not time wasted.
In other words,
>> taking extra time to query design (list-making)
>> taking extra time to test and try entry points for data collection
>> taking extra time for data collection
>> taking extra time to make data ready for exploration and analysis
should be considered as important as data exploration, analysis and visualisation.
Using the workshop as an example, what follows are short descriptions of the side effects of data collection and what it takes to make datasets ready for exploration and analysis.
Data collection
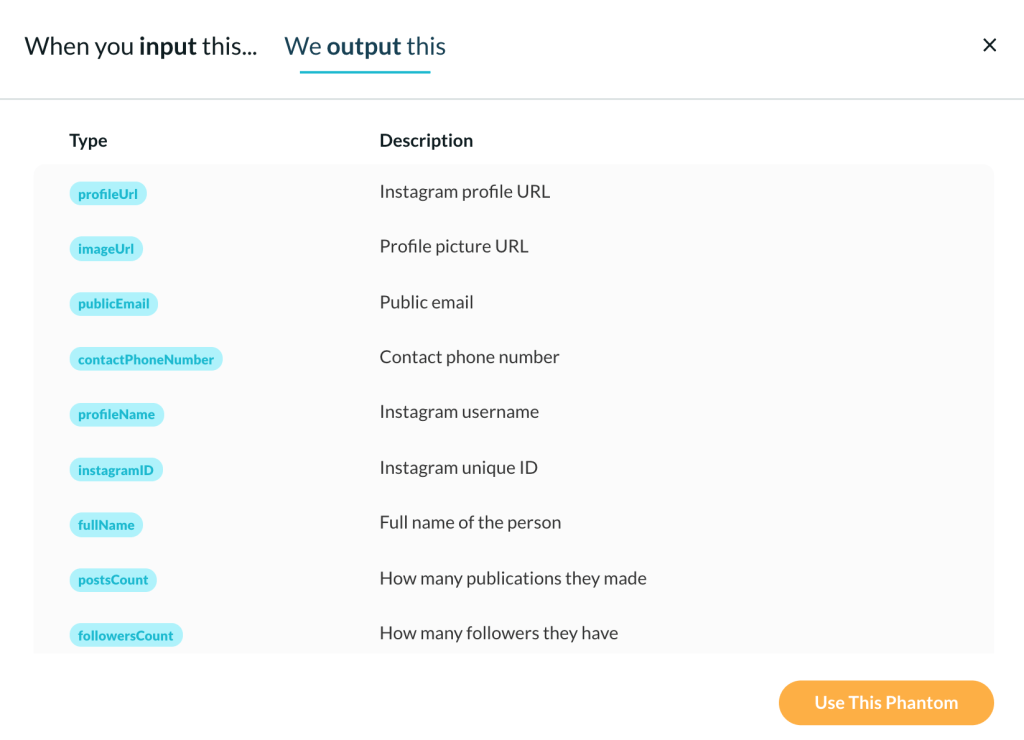
In the workshop, the Desmog database was used as a reference to collect Instagram data based on usernames and, consequently, to get the advantage of account analysis and following networks to study cultures of climate denial. This type of analysis benefits from publicly available information of Instagram profile data and a list of following accounts. For instance, using PhantomBuster, one can scrape public info from a list of profiles, as shown below. In the workshop context, the account analysis approach helped to explore and situate the profile data of climate deniers, understanding how these actors present themselves on Instagram and also providing interesting insights through hashtags, links, text and emoji analysis.
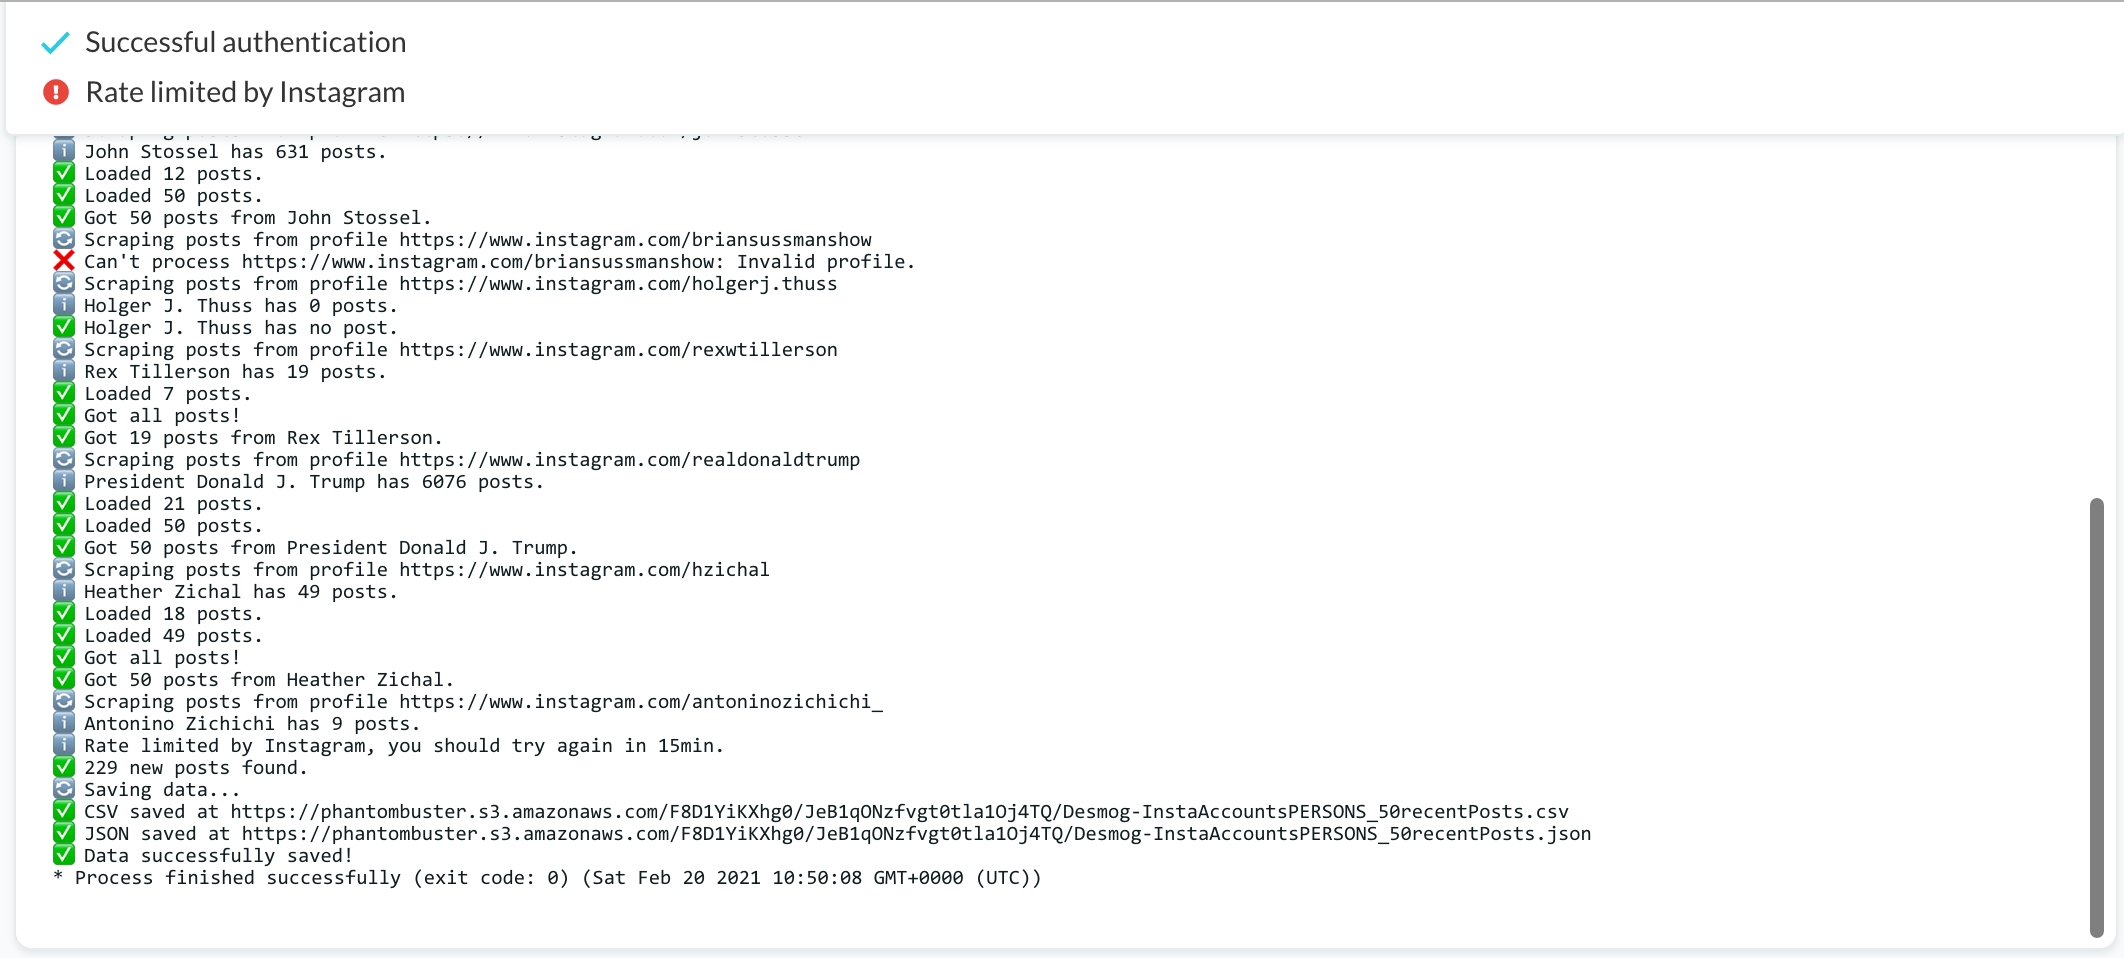
I scraped Instagram data from a list of 178 accounts, including organisations and public figures. I had seven days in total to do this job (not much time, a challenge indeed!). My rush has led me to programme the automated data collection to be more active than it should be. Consequently, when allowing PhantomBuster to act on behalf of my Instagram research account(s), I did not consider the Instagram Graph API rate limits due to lack of time, which later cost me more.
>> Expected side effect when not setting long delays and limiting the amount of data to be scraped
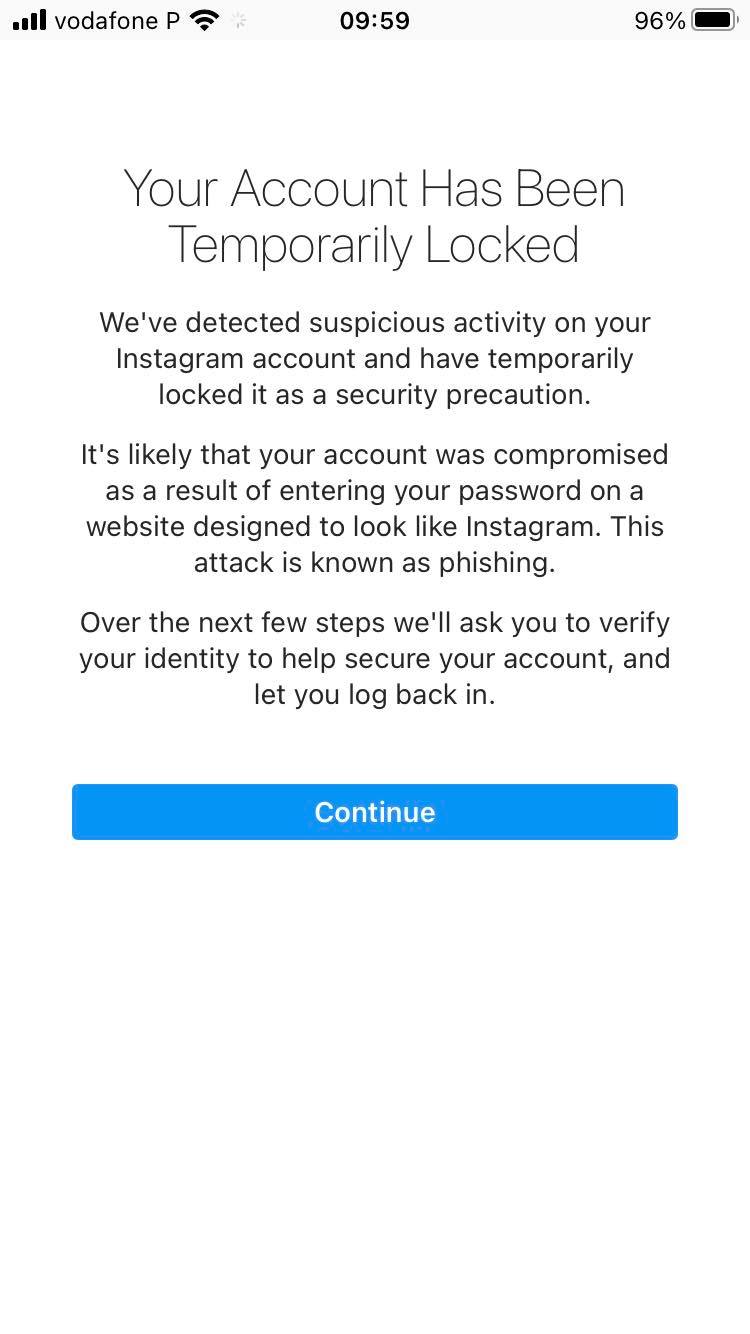
- when scraping Instagram data: you may have your research account(s) blocked by the platform. This means that you will have to spend some time taking care of this issue. So, please, try to avoid this type of problem by being well informed 😏 (don´t worry this is easy to solve).
>> Expected side effects when not setting long delays and limiting the amount of data to be scraped
>> BASIC STEPS BEFORE SCRAPING INSTAGRAM DATA OR CALLING APIS
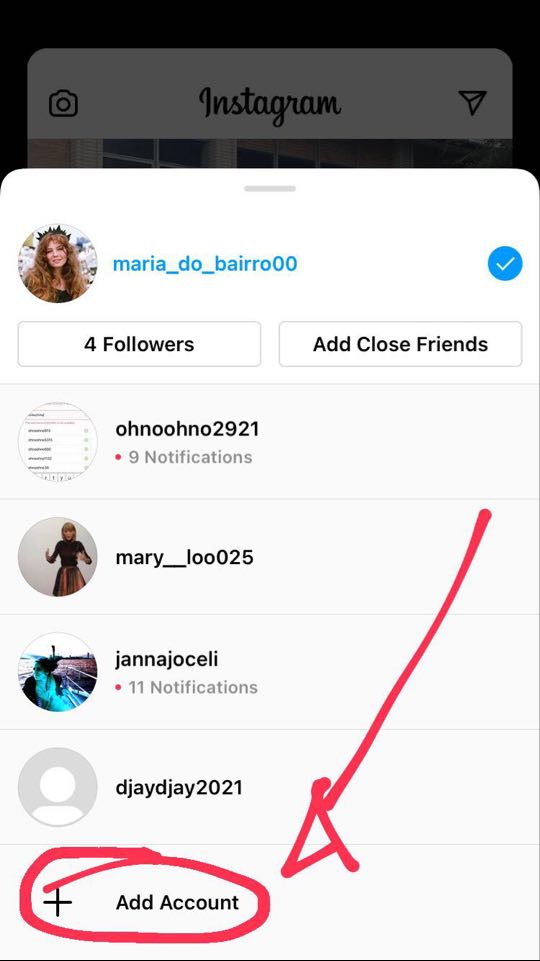
- To scrape Instagram data, create at least three research accounts. It is quite simple to do that by using your mobile phone (see the screenshot below).
- Read API documentation by searching for “limitations” or “rate limits” to understand the restrictions and set data collection parameters accordingly.
- Be attentive to the features offered by the chosen extraction software (e.g., PhanthomBuster).
>> GENERAL CONSIDERATIONS AND PREPARATIONS FOR DATA COLLECTION
Preparation: what do to do and to know in advance?
- Define the platform(s) and the data collection method (s) accordingly, while understanding its affordances and limitations.
- Be aware of the possible entry points (e.g. hashtags, URLs, account name) and data extraction software, knowing how web and platform infrastructure treats web data.
- Read carefully software instructions and, if possible, watch tutorials.
- Read API documentation by searching for “limitations” or “rate limits” to understand the restrictions and potentials afforded by the studied platform.
- Create one or more research accounts (in case you want to avoid using your own social media or other platform accounts).
- Understand the role/impact of your choices and platform mechanisms on the results obtained.
Software specificity and outputs: what basic questions should be addressed?
- What type of information or engagement metrics can be associated with images?
- See the example below or read YouTube Data API, e.g. video list references)
- What type of image URLs can I have access to (e.g. post, profile image, video image thumbnail)? How long do they last?
- What are the limitations to collecting data? Are there alternative solutions?
- Read API documentation by searching for “limitations” or “rate limits” to understand the restrictions and potentials afforded by the studied platform or search engine.
- How far back in time can data be retrieved?
- What are the standard output files? (e.g..TAB, .CSV)

When collecting data: how can I document data collection trials, errors and final attempts?
- Use data collection sheet documentation or text file to record decisions taken and tools used, registering the methodological steps and also justifying potential changes in list-making. This type of documentation should contain, at least, the chosen platform(s), query(ies), extraction software, date of data collection, chosen parameters, outputs, notes. See below some examples:
- This is the data collection sheet documentation for studying political polarization in Brazil, 2016 pro- and anti- impeachment protests.
- This is the data collection sheet documentation for studying Portuguese Universities on Facebook.
- This is a text file that records the data collection process of Instagram’s Weekend Hashtag Project.
Image downloading
Now, back to the workshop context, as soon as I get the list of the following accounts, I moved on to image downloading. Well, the truth is I should have first avoided the duplicates on my dataset. Again, lack of time and hurry made everything more difficult. In fact, it was so many images to be downloaded, and maybe I would face the same problem that I am going to describe now anyway.
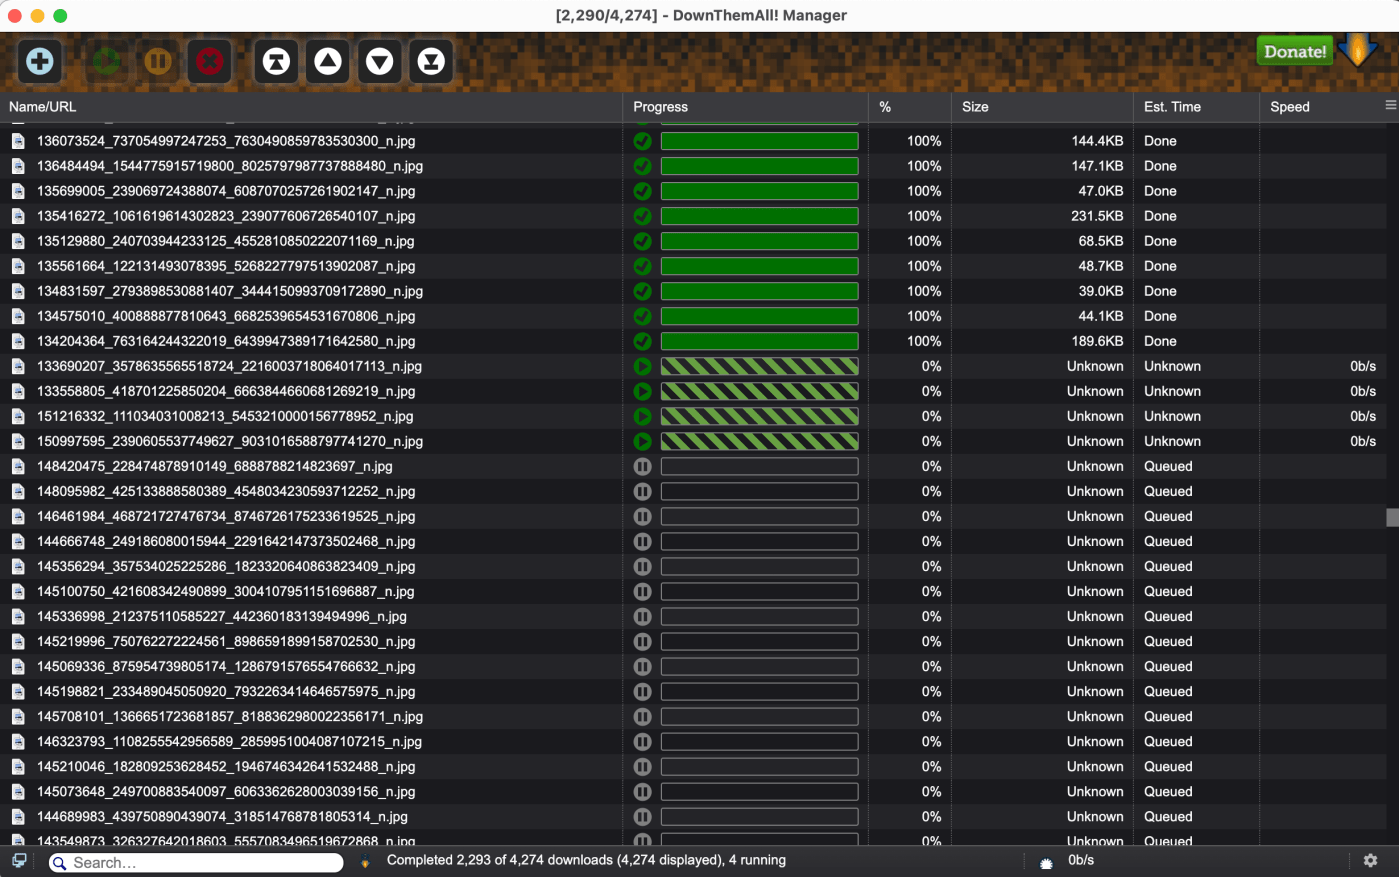
First, I managed to download more than 70.000 images with DownThemAll, and after that, and opening my computer again to another image download task, the browser extension decided to keep downloading the previous list of image URLs. So, my task of downloading only 4,000 images was a nightmare! Next, I started trying to solve the problem around 11 pm (see the video below), I fixed the DownThemAll bug one hour later (more or less) and then the download of the 4,000 images was only completed at 3:40 pm. In the meantime, my computer was acting like a turtle and I could not do anything else. I was forced to wait. That is to say, I was not able to finish this job in 1h30 (or 2h) as I have planned before. This is a situation we cannot control, of course, but also something to keep in mind when using digital methods; something that is actually part of this research practice – whether it is unwanted or not.
Preparing the dataset for data exploration and analysis
This stage took at least a day. Well, if I had some extra skills or knowledge to manage datasets with R or Python, I would probably do it faster (no doubt!), but I used spreadsheets and Excel formulas. You see, my computer is asking to be retired, which also means heavy files takes longer 😭😭 This information serves to put into context much more than complaining.
What did I do? I organised different datasets according to specific lists of usernames. Why did I do it? Because most of the students were about to have their first experience with digital methods. Moreover, the workshop was 100% online, and considering students had no access to good computers I tried to anticipate problems like troubles in opening the heavy files. Is this a good practice for teachers? If there were not so many restrictions due to the pandemic, it would be better to involve students in this type of practice.
What is crucial to situate and contextualise digital data when working with spreadsheets?
First and foremost, we have to consider the platform environment, cultures of use and technological grammar. For instance, when working with a list of accounts and respective metadata, we may want to know how these actors present themselves on the platform.
Second, there are some aspects to consider that help to situate and contextualise the dataset, starting from a general overview to a close observation of the intersections between time, unique user, technological grammar and platform-specific endpoints. But this is the subject of another blog post.
To conclude, the bullet points below emphasise some tasks that illustrate what extra efforts mean in practice 🧐👩🏻💻, when using digital methods. In addition and implicit to that, the emphasis on technical practices as a demanding activity, particularly the time required to accomplish the tasks and some specific technical knowledge that makes a difference when analysing and visualising the dataset.
- Data extraction takes some time!
- Getting data ready for exploration and analysis also takes time.
- Before data analysis, one should make sense of the dataset (situate/contextualise the dataset). Here, again, some time is required.
That said, we should understand that the task of collecting data from the web and preparing it for analysis is a task that needs the intervention and attention of the researcher/student. Different from what used to be thought, such as the idea of extracting data and directly going to analyse it (considering the first attempt as the final one).


Leave a comment