This post concerns my current research on building and interpreting computer vision networks to develop visual digital methods for social and media research. This investigation started a couple of years ago (more precisely in 2017) and it has grown into a project that I’m developing as a research fellow at the Centre for Advanced Internet Studies, Bochum, Germany. I’ll use this post as a research diary, sharing activities and empirical findings related to my research project and this YT playlist to share talks and hows to.
Computer vision networks. Developing visual digital methods for social and media research
Janna Joceli Omena
[abstract] Computer vision networks are valuable assets for digital research. Afforded by machine learning models and a range of research software, these networks inform new ways of enquiring socio-technological phenomena, providing novel perspectives but also challenges for digital visual methods. Although the automated services for describing large image datasets (either by labels or web entities) and the detection of safe search or sites of image circulation have been serving well big tech companies for many years, the potentialities of computer vision for the purpose of digital network studies are still unknown or little explored. Against this background, this research proposal presents two main objectives, which simultaneously interrogates the potentialities and limitations of computer vision APIs for social and medium research, while aiming to develop forms of technical-methodological creation with digital methods. To achieve this goal, the project will explore what counts in the processes of building and interpreting computer vision networks – here taken as an ensemble of machines, data, methods and research practices. The entanglements of a technical understanding of Vision APIs (application programming interfaces) infrastructure combined with the research practices part of the full range of digital methods (curating, capturing, visualising, analysing and repurposing online data and methods) and visual network exploration are to be taken into account. Through situated case studies, this project aims to shed light on how to read networks of images and their correspondent descriptions, and networks of images and their sites of circulation across the web. The expected results include practical and conceptual research models for using computer vision networks in social and medium research.
[Project development]
June 2022, Introduce the computer vision network approach to analysing meme collections at the University of Warwick. This presentation is part of a series of forthcoming Sage Video tutorials, which I recorded with Richard Rogers. The slides were slightly adapted for my talk, making the presentation more explanatory and less step-by-step tutorial. See below the programme and detailed info about the talks (cross-post).
January 2022, CAIS Colloquium I 26 January 2022, 4:00 – 6:00 pm I Fellowship closing presentation: Making methods with vision APIs, online data and network building (lessons learnt). Slides: https://www.slideshare.net/jannajoceli/making-methods-with-vision-apis-online-data-network-building-lessons-learnt // Implementation of method recipes for using Memespector GUI outputs at the SMART Data Sprint 2022 and at the Digital Methods Winter and Summer Schools 2022. Projects and workshops:
- [project report] After all, what are bolsobots like these days?
- [tutorial] Memespector GUI: Enriching image data with AI (with Jason Chao)
- [project report] What is a meme, technically speaking?
- [tutorial] Enriching image data with AI (with Jason Chao)
September – December 2021, implementation of the method recipe for building and interpreting computer vision networks with Erasmus Mundus master students of NOVA University Lisbon (NOVA FCSH).
October 2021, Invited online talk at the Universidade Federal da Bahia: Visão computacional – metodologia digital para análise de images, video: https://www.youtube.com/watch?v=ALDTNulh4HE
September 2021, publication of a methodological paper on Journal Diseña: The potentials of Google Vision API-based networks to study natively digital images.
- English version: http://www.revistadisena.uc.cl/index.php/Disena/article/view/27271/33509
- Spanish version: http://www.revistadisena.uc.cl/index.php/Disena/article/view/27271/33515
August 2021, the first draft version of a recipe for building and interpreting computer vision networks
July 2021, CAIS Data Sprint with Warren Pearce and Carlo De Gaetano to study “climate emergency” & “climate change” web entities-image networks, while asking: what are the web entities good for? Implementation of method recipes for using Memespector GUI outputs at the Digital Methods Summer School 2021.
- Recipes short link: bit.ly/dmi21-recipes-memespectorGUI
- Workshops: Enriching image data with AI ˚˚ Slides: https://bit.ly/DMI21-tutorial_MemespectorGUI // Visual Content Analysis with Image Query and Extraction ˚˚ Slides: https://bit.ly/DMI21_ImageQueryTool
- Projects: Mapping deepfakes with digital methods and visual analytics (see computer vision methodology and findings) // Profiling Bolsobots Networks (see the findings of #Aesthetic correlations between images and topics)
May 2021, Collaborative project with Jason Chao to expand Memespector GUI, which now supports multiple vision APIs, and to create a simple command-line script to facilitate images analysis: Image Query and Extraction Tool. CAIS Data Sprint with Rita Sepúlveda and José Moreno to study the circulation of COVID misleading images originated on WhatsApp.
17 March 2021, Center for Advanced Internet Studies. Slides: bit.ly/computer-vision-networks_v1 // Video: bit.ly/computer-vision-networks_v1-video
4 September 2020, Medium post: https://medium.com/inovamedialab/computer-vision-networks-631b5139dc28
24 June 2020, The University of Sheffield. Slides: bit.ly/computer-vision-networks_original-proposal // Video: bit.ly/computer-vision-networks_original-proposalVideo
[Papers using computer vision networks]
Omena, J. J., Rabello, E. T., & Mintz, A. G. (2020). Digital Methods for Hashtag Engagement Research. Social Media + Society. https://doi.org/10.1177/2056305120940697
Omena, J. J., & Granado, A. (2020). Call into the platform! Merging Platform Grammatisation and Practical knowledge to study digital networks. Journal ICONO14, 18(1), 89-122. https://doi.org/10.7195/ri14.v18i1.1436
[Data sprints’ project reports using computer vision APIs to research purposes in which I pitched, collaborated or facilitated]
2021
https://smart.inovamedialab.org/2021-platformisation/project-reports/investigating-cross-platform/ https://wiki.digitalmethods.net/Dmi/WinterSchool2021Deepfakes https://wiki.digitalmethods.net/Dmi/SummerSchool2021BolsobotsNetworks
2020
https://smart.inovamedialab.org/2020-digital-methods/project-reports/cross-platform-digital-networks/ https://smart.inovamedialab.org/2020-digital-methods/project-reports/cross-platform-digital-networks/climate-change/
2019
https://smart.inovamedialab.org/past-editions/smart-2019/project-reports/interrogating-vision-apis/ https://wiki.digitalmethods.net/Dmi/SummerSchool2019Botsandtheblackmarket
2017 https://wiki.digitalmethods.net/Dmi/InstagramLivenessVisualisingengagement
19 July 2021, COMPUTER VISION ANALYSIS & TUTORIALS – DMI Summer School 2021
In the first week of July, Jason Chao and I led two tutorials at the Digital Methods Summer School 2021 about image analysis with computer vision. In the tutorials, we introduce the new version of Memespector GUI (a research software that was expanded to invoke multiple vision APIs during Jason’s visit to CAIS) and the Offline Image Query and Extraction Tool (a simple tool that facilitates a qualitative approach to image analysis, developed by Jason and conceptualised by myself). In case you´re interested in image analysis mediated by computer vision, check the links to the slides of our tutorials 🙂
Enriching image data with AI
Slides: https://bit.ly/DMI21-tutorial_MemespectorGUI
Visual Content Analysis with Image Query and Extraction
Slides: https://bit.ly/DMI21_ImageQueryTool
I shared recipes for using Memespector GUI outputs>> bit.ly/dmi21-recipes-memespectorGUI, part of a method framework to curate, build and interpret computer vision networks that I’m developing at CAIS.
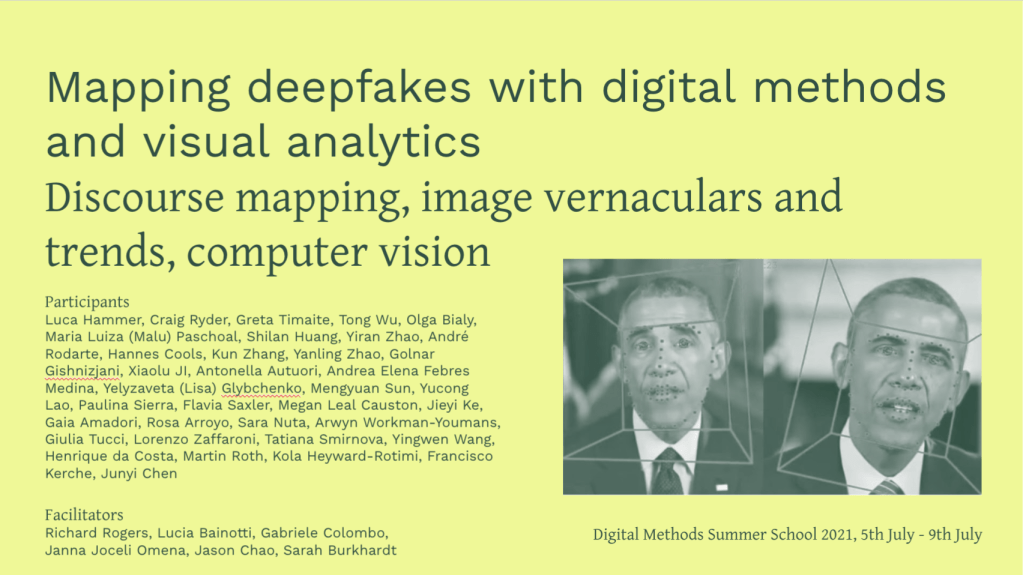
During the first week, I was one of the facilitators of the project mapping deepfakes with digital methods and visual analytics. A great opportunity indeed to work in collaboration and apply some of the techniques I’ve developed to read computer vision networks. Pitched by Richard Rogers, Lucia Bainotti, Gabriele Colombo and Sarah Burkhardt the project asked:
- What are the discourses surrounding the issue of deepfakes?
- How are these discourses evolving over time?
- What are the key actors, industries, software and interests surrounding deepfake technologies?
To answer these questions, we explored Twitter and Google images (see the details of the dataset building below) using three main approaches: Discourse mapping; Image vernaculars and trends; Computer vision analysis.
<DATASETS>
[#deepfake OR #deepfakes]
01-01-2017 until 1-06-2021
95.831 tweets
19.713 unique photo URLs
Google Image Search
[deepfake]
Geolocation, country codes and timeframes:
NL (2017-2021) | BR (2019-2021) | UK (2021) | US (2021)
Total amount of images: 10.066
The computer vision analysis sub-project was led by myself & the amazing Sarah Burkhardt, and had 23 participants who engaged with three computer vision approaches:
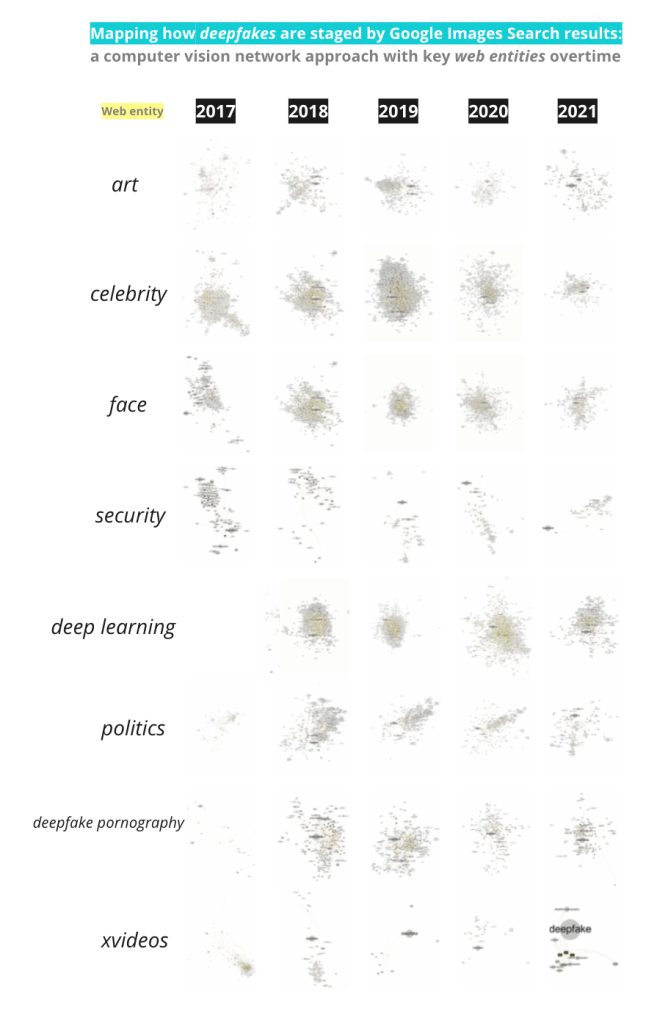
i) Web entities for Google Image data over time
What are the related web entities around deepfake over time?
What can technology, cultural and porn related web entities tell us about deepfakes overtime?
ii) Image circulation: Google Images & GV fully matching images
What are the online sites of deepfake’s circulation over time?
What can Google Vision’s pages with full matching images tell about changing infrastructures around deepfake?
ii) Geographical mapping: Twitter & GV web entities
Where do #deepfake images circulate geographically on Twitter over time?
What are the country-specific discourses around deepfake?
The report of this project will be soon available at DMI Wiki.
1 July 2021, UNDERSTANDING WEB ENTITIES THROUGH CLIMATE CHANGE & CLIMATE EMERGENCY IMAGES – CAIS Data Sprint with issue experts
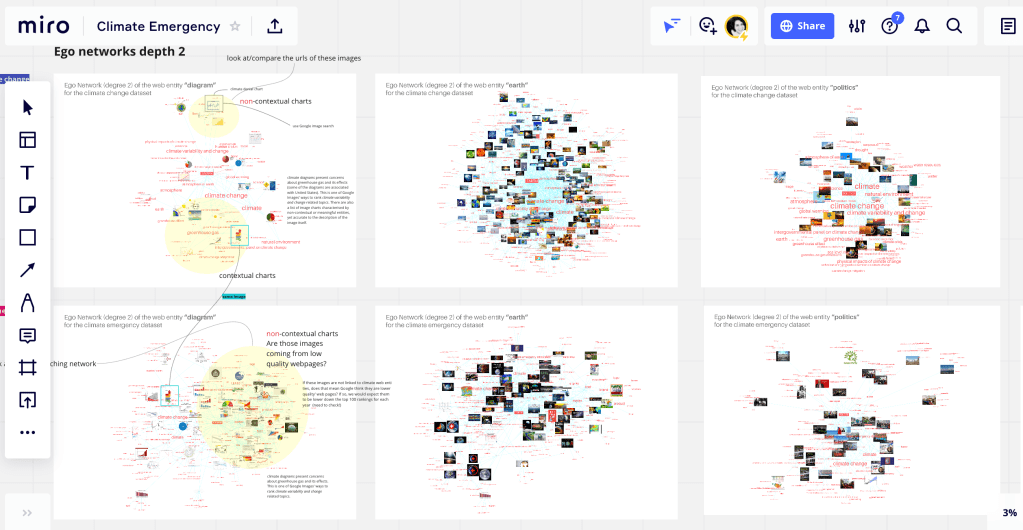
Last week I received Warren Pearce (University of Sheffield, UK) and Carlo De Gaetano (University of Amsterdam, The Netherlands) to sprinting with web entities-“climate emergency” & “climate change” images networks. We asked what are the web entities good for? what’s beyond the image?, knowing in advance that web entities (a person, a place/location or a thing) are textual descriptions to images based on web content. Considering the level of specificity afforded by Google’s web entities, the recommended approach to benefit from a network of web entities and images is the exploration of ego networks. This was what we did.
Warren, Carlo and I had insightful and though-provoking discussions about the role web entities to study online images. Further collaborations to come. The data sprint at CAIS led us to a collaborative project on Climate Images & web entities networks.
24 May 2021, – Interrogating proprietary and open-source computer vision APIs with the new version of Memespector GUI – Collaborative project with Jason Chao at CAIS
Last week I had the pleasure to welcome Jason Chao as a CAIS visiting fellow in support of the project I am developing there. The week was incredibly productive and inspiring. Jason has expanded Memespector GUI to support more proprietary computer vision APIs and also an open-source model. I think this research software is a real game-changer in doing digital media research. Along the week we had the opportunity to create another research tool named Offline Image Query and Extraction Tool, developed by Jason and conceptualise by myself. See below the details and links for both research tools and also the abstract of this collaborative project.
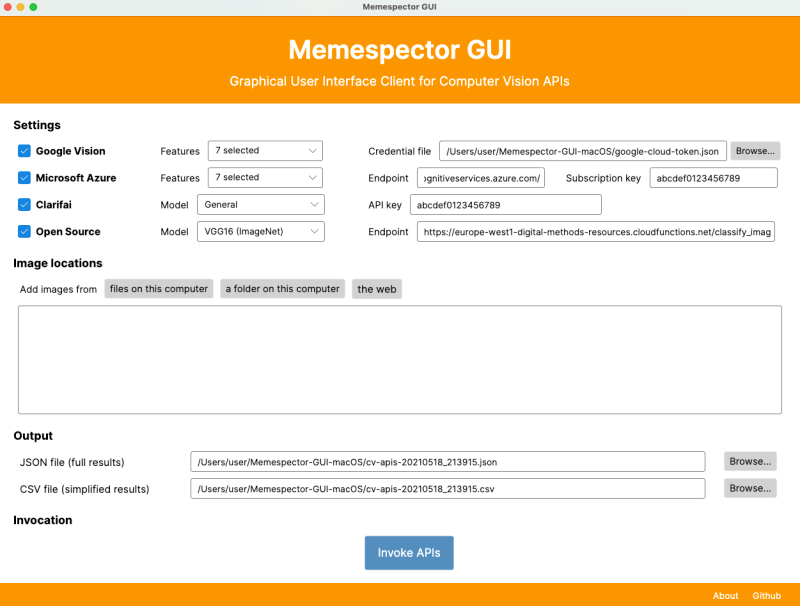
Memespector Graphical User Interface (GUI): research software that supports multiple computer vision APIs developed by Jason Chao.
Reference:
Chao, T. H. J. (2021). Memespector GUI: Graphical User Interface Client for Computer Vision APIs (Version 0.2) [Software]. Available from https://github.com/jason-chao/memespector-gui.
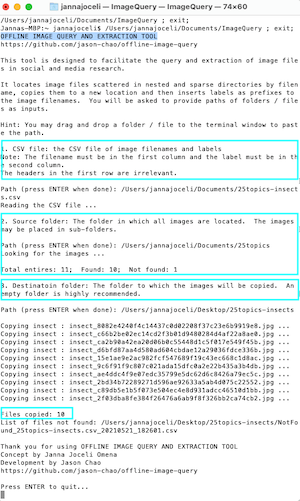
Offline Image Query and Extraction Tool: a command-line tool that locates image files scattered in nested and sparse directories by filename, copies them to a new location and then inserts labels as prefixes to the image filenames. This tool serves the study of visual content for social or media research but it is not limited to this purpose, allowing researchers to explore and analyse specific collections of images on demand.
Reference:
Chao, T. H. J. & Omena, J. J. (2021). Offline Image Query and Extraction Tool (Version 0.1) [Software]. Available from https://github.com/jason-chao/offline-image-query.
[project abstract]
Interrogating proprietary and open-source computer vision APIs with the new version of Memespector GUI
The potentialities of computer vision APIs are valuable assets for digital research but still little explored for social and medium studies. To date, script files are the main tools available to get an advantage of computer vision APIs, while graphical user interface-based tools are rare, serving only a computer vision API at a time. Against this background, the objective of this collaborative project is first to expand the features of Memespector Graphical user interface (GUI)* (Chao, 2020), an open-source research software tool originally created to repurpose Google Cloud Vision API to the study of collections of images. The new version of Memespector GUI will support more proprietary computer vision APIs such as Clarifai and Microsoft’s Cognitive Services. Moreover, Memespector GUI will support a newly-created open-source API that classifies images using multiple open-source pre-trained deep learning models. The second objective is to test, try and validate the new version of the Memespector GUI while proposing a step-by-step protocol for researchers to make use of the tool for querying proprietary and or open-source computer vision APIs. To that end, the project will compare the outputs of different machine learning models using the same collection of images. Therefore, the project attempts to analyse and compare the range, modes and granularity of image labelling and also its lack of precision relying on computing and visual methods. With robust empirical evidence, the expected results include the provision of a profile description of the labelling and semantic capacities of the proprietary and open-source computer vision APIs, expanding the analytical horizon of such algorithmic systems (see Rieder & Hofmann, 2020). Once stabilised, the new version of Memespector GUI combined with the publicly available step-by-step protocol for researchers would facilitate both the use and study of computer vision APIs for social and medium research.
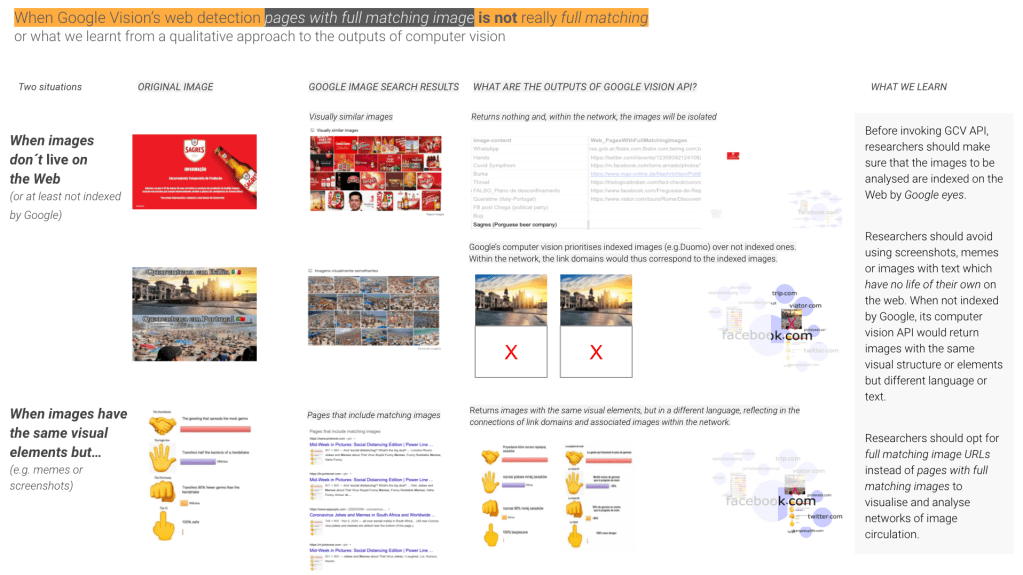
16 May 2021, WHEN GOOGLE’S VISION FULL MATCHING IS NOT REALLY FULL MATCHING – CAIS Data Sprint with issue experts
The preliminary findings I´m sharing below result from the CAIS data sprint with Rita Sepúlveda and José Moreno, both researchers from ISCTE-Iul, CIES-Iscte, Portugal. They are involved in a project that monitors and analyses cases of disinformation in Portugal concerning the pandemic crises. In this collaborative project, Rita and José asked whether misleading images originated on WhatsApp in the early days of the pandemic have circulated across web platforms and who were the actors associated to the images, while I was wanted to interrogate the computer vision API itself and address some basic questions that one can ask when using networks of image circulation. While the report of this project is being written, I wanted to share some significant empirical findings that are quite obvious in theory but better understood after qualitative and visual analysis of the data and the networks.
23 April 2021, INSIGHTS ABOUT READING NETWORKS OF IMAGE CIRCULATION – #SMARTDataSprint
In the context of a SMART Data Sprint project, namely Investigating cross-platform visual issuefication: the case of Brazil’s Pantanal wildfires, coordinated by Carlos d’Andréa and André Mintz and developed by a team constituted by seven researchers (namely Débora Salles, Fabio Gouveia, Federica Laurencio, Jahnnabi Das Leonardo Melgaço and Priscila Yoshihara) including myself, I had the opportunity to explore and analyse a computer vision network of image circulation concerning the Pantanal fires in Brazil (other exploratory studies about this type of network can be found here or here).
So, what I want to register here is a response to the following question:
When using ForceAtlas2, how can we interpret node positioning in the image circulation network?
I´ve been arguing that ForceAtlas2 may provide a narrative thread that has fixed layers of interpretation[1] such as centre, mid-zone, periphery, and isolated elements and multiple forms of reading (see Omena & Amaral, 2019; Omena et al., 2020). Such narrative affordances reflect the way in which this force-directed algorithm function; it responds to attraction force vs. repulsion by degree and these forces create a movement that converges to a balanced state (in positioning the nodes within the network). In practical terms, what I understand by this balanced state, and on the basis of various empirical evidence, is that we can assume that in the centre of the network we would see the nodes that gather more diversity and variety in their connections, being there, in some cases, the most connected nodes (e.g. in the networks of co-occurrences of hashtags) or the most popular nodes (e.g. networks of recommendation, the case of similar apps or related videos on YouTube). In the mid-zone, we find influential or bridging actors as well as empty zones (lack of connections); while the periphery is a space that reveals different perspectives and particularities either in terms of content or platform specificity.
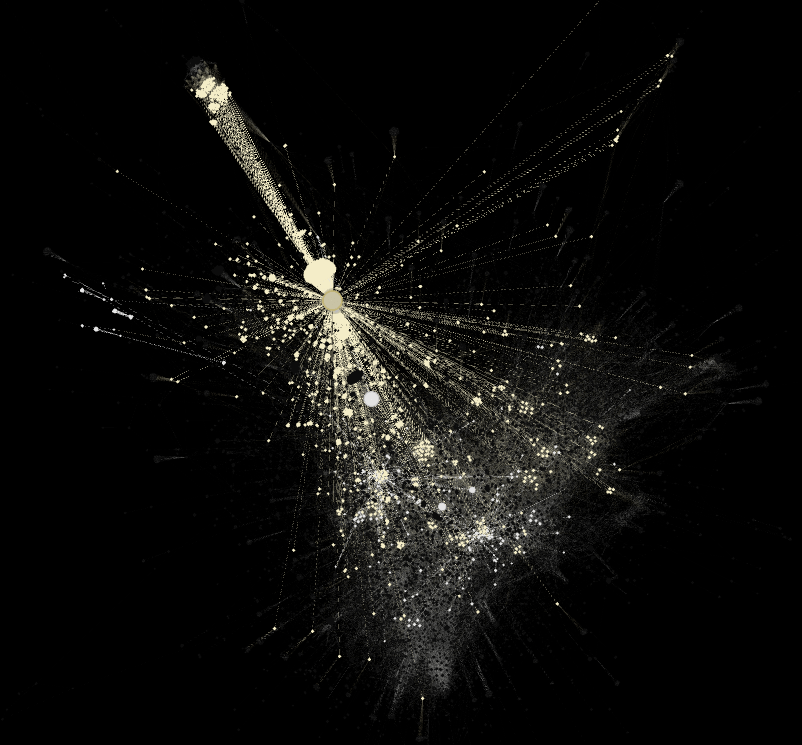
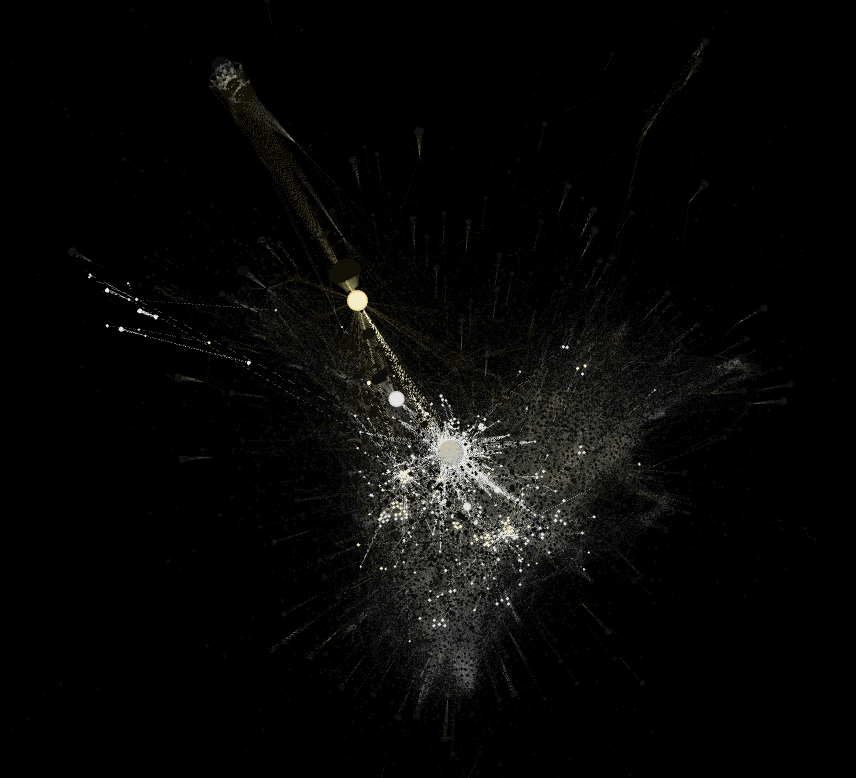
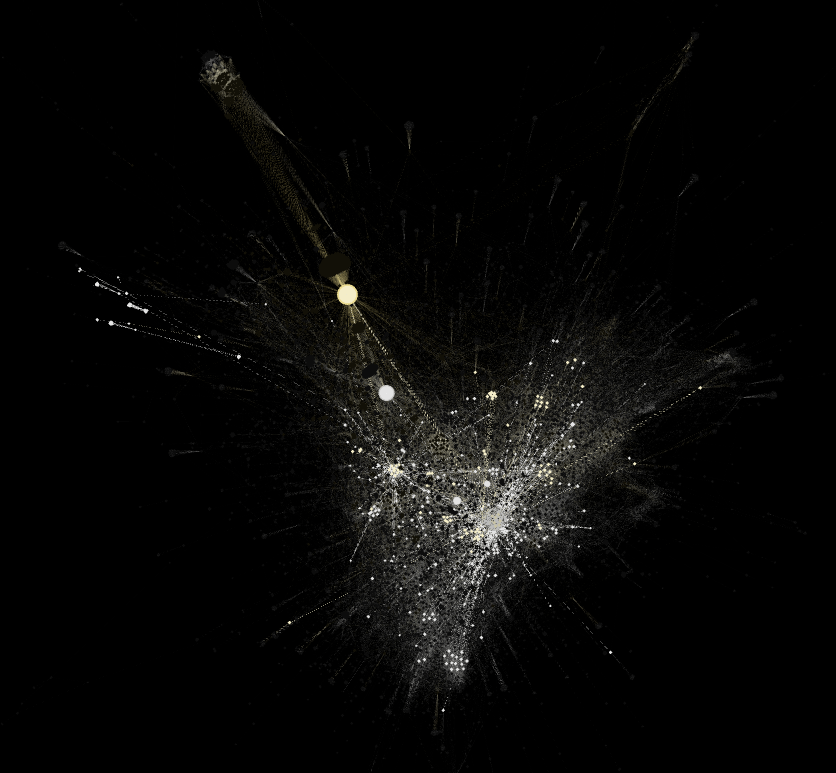
That said, it is crucial to understand how connections are made. In other words, what makes the nodes of a network bigger or smaller, e.g. occurrences of hashtags, comments, recommendations, likes, retweets, shares. In the case of the network of 2020 Pantanal wildfires image circulation, what makes on type of nodes bigger (webpages) is the number of times full matching images (the other node type) appear in a page. Who gives me this information is the module web detection of the Google Cloud Vision API. So, in the network visualisation below, the biggest node is Facebook which is just as important as the nodes located in the centre of the network and highlighted in blue. Facebook holds the majority of image appearance, while the centre of the network shows webpages (in this case, news media websites) capable of gathering a more diverse range of images. In this understanding, I relied on Gephi affordances to visually detect the neighbors of Facebook within this network, highlighting in yellow all images that appeared on this platform. This decision guided the interpretation of the network. The question of whether images sticks and flows out of platforms is also visually informed (read the legend of the three network visualisation below with the black background).
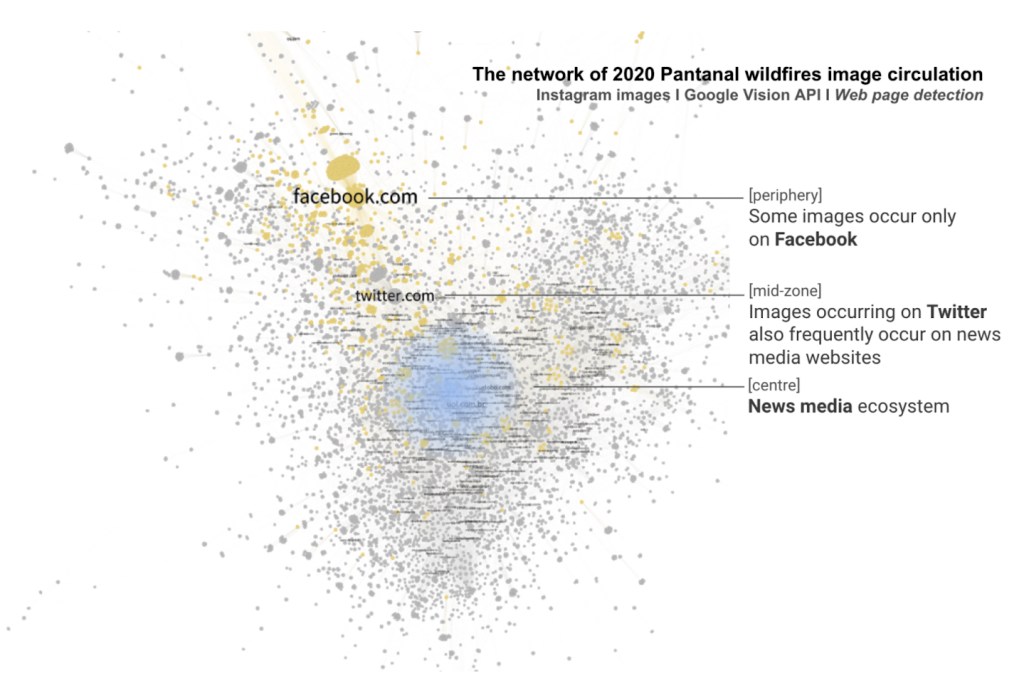
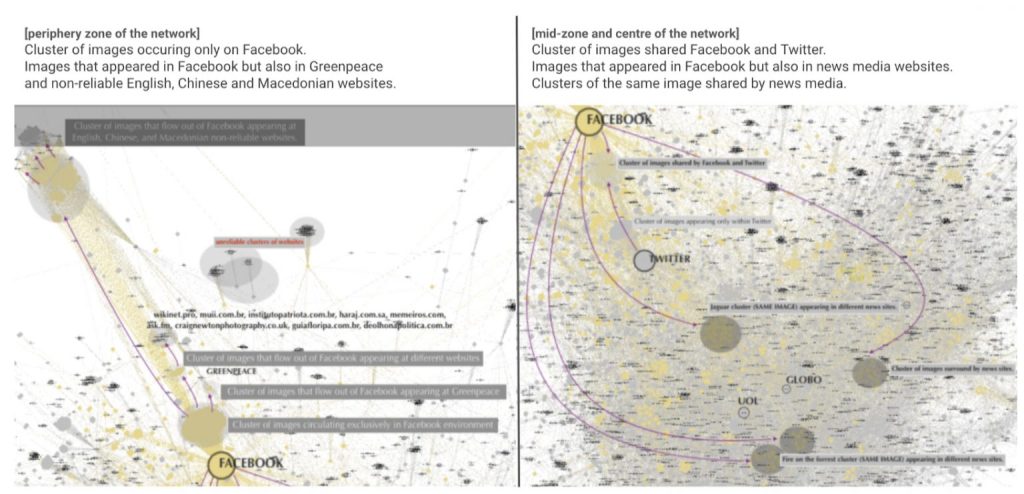
Computer vision network of 2020 Pantanal wildfires: analyses of images and sites of occurrence. 12.244 nodes: 7.566 top-level domains and 4.678 images. Above is an overview of the whole network, while the images below zooming in on the periphery zone (left) and mid and central zones (right) of the network. Image source: https://smart.inovamedialab.org/2021-platformisation/project-reports/investigating-cross-platform/
[1] Since 2018 this proposal has been tried-and-tested in and out of the context of data sprints; for instance, it was used to read networks of recommendation, paying attention to the recommendation of similar apps in Google Play Store (e.g. https://wiki.digitalmethods.net/Dmi/SummerSchool2018AppStoresBiasObjectionableQueries, https://smart.inovamedialab.org/past-editions/smart-2019/project-reports/journalism-apps/) or to the related videos suggested by YouTube algorithms (e.g. https://wiki.digitalmethods.net/Dmi/SummerSchool2018MappingWarAtrocities). The fixed layers of interpretation was also tested in networks of hashtags, networks of following accounts and networks built on top of computer vision APIs (e.g. https://thesocialplatforms.wordpress.com/2019/12/07/reading-digital-networks/, https://smart.inovamedialab.org/past-editions/smart-2019/project-reports/interrogating-vision-apis/, https://wiki.digitalmethods.net/Dmi/SummerSchool2020GoodEnoughPublics).
24 June 2020, ONLINE RESEARCH SEMINAR – The University of Sheffield.
Slides: bit.ly/computer-vision-networks_original-proposal
Video: bit.ly/computer-vision-networks_original-proposalVideo
4 September 2020, MEDIUM POST – iNOVA Media Lab & R-EST.
This post concerns experimental and exploratory research on digital networks, more specific speaking networks afforded and built upon computer vision. An important note is that this post was originally published at Medium, and yes, before you ask, I did copy and paste the content here. Despite of that, and considering the informative and descriptive characteristics of this post, I hope it is worthwhile reading.
******Source: https://medium.com/inovamedialab/computer-vision-networks-631b5139dc28 Portuguese Version: https://medium.com/r-est/redes-de-vis%C3%A3o-computacional-ab82579560a7
++++++++++++++++++++++++++++++++++++++++++++++++++++++++++++++
Computer vision web services have been serving well big tech companies for many years and with exponential growth over the years. However, the potentialities of artificial intelligence and machine learning models for the purpose of digital network studies are still unknown or little-explored. There is nothing to blame on this lack of exploration, after all, we are talking about networks that demand to be created and, not exactly about networks afforded by social media APIs. This is the case, for instance, when one uses YouTube Data Tools to visualise and explore networks of video-content relatedness or to map political affinities through channel networks. Computer vision networks meet an ever-more-complex context because they are built upon
i) pre-trained machine learning models; ii) the advantages of software and data for building and plotting networks; iii) and, not least, the medium-specific perspective proposed by digital visual methods.
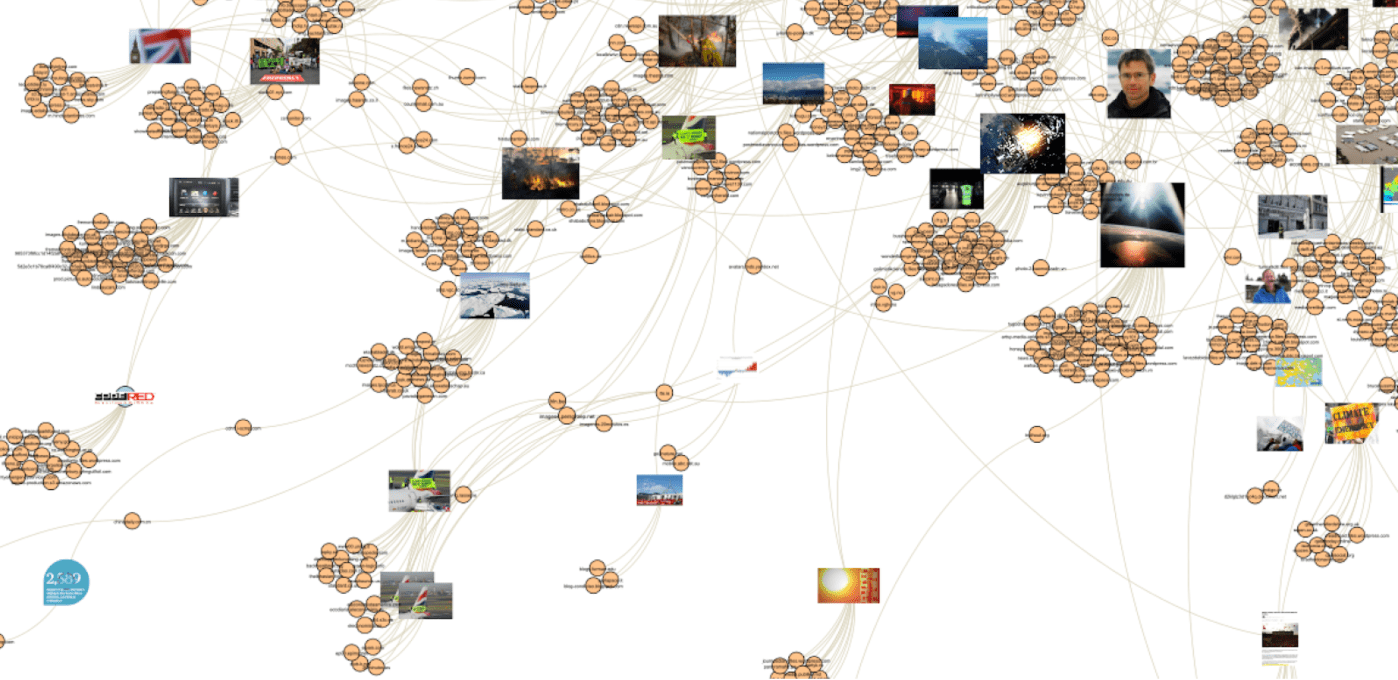
This attempt to define computer vision may speak for itself, right? I mean, computer vision networks are not so simple as they may look like — such as the beautiful network visualisation above. In this network, we see the visuality of “climate emergency” according to Google Image Search results and their sites of circulation according to Google Vision’s web page detection module. The creation and purpose of this network are explained elsewhere (here and also here), but, now, more important is to understand what is inherent to the process of building and analysing such type of network. That is a process made of many layers of technical mediation; a research process that also makes the existence of digital visual methods.
This short introduction sets the scene for my first Medium Story (I’ve written more stories elsewhere) which raises questions such as: Why should new media scholars look at vision APIs for studying networks of images? What for? How to read these networks? As you may have realised, yes, this story will be quite informative and descriptive as well.
But before responding to these questions, there is another important note to be highlighted that concerns the original proposal of merging machine vision and networks for social research; introduced by a group of designers and researchers in 2017 (Donato Ricci, Gabriele Colombo, Axel Meunier and Agata Brilli). Their work has inspired other scholars, including myself, in exploring computer vision networks as much as benefiting from the interesting findings afforded by these networks.
A second important note concerns the types of services that are currently offered by the main artificial intelligence and machine learning services web-based services. In the alluvial diagram below (which does not provide a thick description of these services), we see the services and the year of the launch of Amazon Rekognition, Google Vision API, Microsoft Azure, Clarifie and Imagga. Image automated classification with basis on predefined labels and content moderation (or the detection of unsafe content, e.g. sensitive, violent or porn content) are the services shared by all Vision APIs. The detection and recognition of faces and facial attributes, demographic analysis and celebrity detection are other potentialities afforded by computer vision. Moreover, specific features of Amazon Rekognition called my attention, such as detecting labels in a video or detecting people path in stored videos. This latter provides information about “the location of the person in the video frame at the time their path is tracked and facial landmarks such as the position of the left eye when detected”.

Why computer vision for studying networks of images?
Web-based vision APIs have indeed several affordances, not only positive in terms of re-purposing technologies but controversial and problematics for research. However, here, I will be addressing specific elements of Vision APIs and their potentialities for social and medium research. Basically speaking, see below three features that allow the creation of image networks:
- Image classification according to pre-defined or custom labels which allow the building of networks of images and their descriptive layers.
- The detection of web entities in an image which allows the building of networks of images and their web entities
- The detection of web pages in which an image has appeared allowing networks of images and their sites of circulation across the web.
While the so-called image-label networks have been gaining space in digital research over the years by facilitating the interpretation of large image datasets, the potentialities of computer vision image-web entities and image-domain networks are still underexploited. Here we face innovative methodological attempts that aim to develop new forms re-purposing computer vision for digital networks-driven studies. To illustrate how the three networks look like, also to understand their particularities, see the visualisation below.

What for?
How computer vision networks may serve digital research? What for? What research questions can be made? To respond to these questions, let´s keep using the same structure previously presented, but feeding it with extra information.
- Image classification according to pre-defined or custom labels which allow the building of networks of images and their descriptive layers. Computer vision image-label networks serve as means for studying, mapping and exploring the imagery of (based on pre-defined or custom labels) and for interrogating the medium (the vision API in itself). For instance, the imagery of political polarisation, institutional communication, issue networks, cultural representation etc. While doing so, we can also detect the limitations and bias of the Vision API.
- The detection of web entities in an image which allows the building of networks of images and their web entities. Computer vision image-web entities networks serve as means for studying, mapping and exploring the imagery of (labels obtained from the Web) and for interrogating the medium (the vision API in itself combined with the cultures of use within the Web environment and its infrastructure). For instance, using web entities descriptive terms to the study of a collection of images related to Covid-19 or Zika virus (e.g. before an image containing the mosquito that transmits the Zika virus, Google vision API would return labels such as Chikungunya virus infection, mosquito-borne disease, outbreak, infection).
- The detection of web pages in which an image has appeared allowing networks of images and their sites of circulation across the web. Computer vision image-label networks serve as a means for studying image circulation – the sites of image appearance across the web and the related actors (link domains). Moreover, it allows the detection of the visuality that sticks within or flows out of social platforms. If compared with the previous ones, computer vision image-domain networks have a dynamic view of the subject of study. They also allow both the detection of the dominant link domains within the network (those capable of gathering a more diverse number of image appearances) and the detection of clusters of link domains that share similar visualities.
How to read computer vision networks?
This is definitely the most complex question here, that is also the reason I am writing an academic article about it. So, instead of sharing solutions, I am closing this medium story with preliminary findings that may help the exercise of reading computer vision networks (see below).
 Image source:
But, I also want to say that in order to read computer vision networks, we should first address another type of question:
What precedes and takes place with and in computer vision networks?
This is actually “the question” or what drives us to reflect on the challenges of using digital visual methods for social and medium research. Let´s say that the first step has been taken, through the provision of a technical description and definition for computer vision networks and the introduction of their potentialities for digital research. Let’s get back to talk about this matter in the near future, shall we?
If you want to learn more about the affordances of computer vision networks for digital research, have a look at the following list of papers:
Ricci, D., Colombo, G., Meunier, A., & Brilli, A. (2017). Designing Digital Methods to monitor and inform Urban Policy. The case of Paris and its Urban Nature initiative. In: 3rd International Conference on Public Policy (ICPP3)-Panel T10P6 Session 1 Digital Methods for Public Policy. SGP, 2017. p. 1–37.
Mintz, A., Silva, T., Gobbo, B., Pilipets, E., Azhar, H., Takamitsu, H., … Oliveira, T. (2019). Interrogating Vision APIs. Lisbon. Retrieved from https://smart.inovamedialab.org/smart-2019/project-reports/interrogating-vision-apis DOI: 10.13140/RG.2.2.17204.40323
Omena, J.J., Chao, J., Pilipets, E., Kollanyi, B., Zilli, B., Flaim, G., … Nero, S. (2019). Bots and the black market of social media engagement. https://doi.org/10.13140/RG.2.2.30518.52804
Omena, J.J., & Granado, A. (2020). Call into the platform! Revista ICONO14 Revista Científica de Comunicación y Tecnologías Emergentes, 18(1), 89–122. https://doi.org/10.7195/ri14.v18i1.1436
Omena, J. J., Rabello, E. T., & Mintz, A. G. (2020). Digital Methods for Hashtag Engagement Research. Social Media + Society. https://doi.org/10.1177/2056305120940697
Geboers, M. A., & Van De Wiele, C. T. (2020). Machine Vision and Social Media Images: Why Hashtags Matter. Social Media + Society, 6(2). https://doi.org/10.1177/2056305120928485
Two references for Portuguese speakers:
Silva, T., Mintz, A., Omena, J. J., Gobbo, B., Oliveira, T., Takamitsu, H. T., … Azhar, H. (2020). APIs de Visão Computacional: investigando mediações algorítmicas a partir de estudo de bancos de imagens. Logos, 27(1), 25.54. https://doi.org/doi:https://doi.org/10.12957/logos.2020.51523
Silva, T.; Barciela, P.; Meirelles, P. Mapeando Imagens de Desinformação e Fake News Político-Eleitorais com Inteligência Artificial. 3o CONEC: Congresso Nacional de Estudos Comunicacionais Da PUC Minas Poços de Caldas — Convergência e Monitoramento, 413–427, 2018. Retrieved from https://conec.pucpcaldas.br/wp-content/uploads/2019/06/anais2018.pdf


Leave a comment