Intending to grasp the technicity of digital platforms, I´ve been following up on social media APIs for a while. This model (a work still in progress) also questions what one should look at social media APIs. I argue that the main reason for looking at social media APIs consists of two key strands that allow for the repurposing of digital research (both in theory and in practice).
One entails digital grammatization that enables activity to be made discrete, reproduced (Stiegler 2006; 2012) and retrievable. The other embraces APIs’ forms of communication/materialization with users (front-end interface) and with software (back-end interface). Discussions on post-API social media research have recently increased due to the growing restrictions on APIs data access regimes. This debate reaches its peak in 2018 with Facebook data misuse revelations. I want to bring into the discussion that the shift in emphasis from API-led research to an API-less dependent based research (or even the current mood ‘what should we do now?’) must not drive our attention away from the role of APIs for social media research.
If we assume APIs as mediators and organizers of social activity, we should start caring about their role in society and, consequently, in digital research. In a short interview for IBPAD (Brazilian Institute of Research and Data Analysis), I compared the type of knowledge required by a traditional research instrument – the questionnaire, with the knowledge, demanded by an API (if you’re able to understand Portuguese, see in the video below the minute 4:26). We can certainly affirm that questionnaires or interviews are the principal means of enquiring into our digital life and society. Whereas, social media APIs have been serving as a more instrumental tool or pathway to study social phenomena. There is something that may justify such a perspective, which is the attitude of digitization of methods or a form of approaching the digital from the outside in (Rogers, 2013; Marres, 2017).
However, this exercise of comparing the technique of making a questionnaire with the technique of interrogating APIs for studying society serves to turn our attention to a change of mindset in doing digital research. In other words, what is natively digital requires a natively digital approach (by no means I´m despising non-digital approaches). Consequently, and in the same way we master the formulation, application and analysis of questionnaires (or interviews), we must also master APIs or at least their common practices and methodological issues. In this post, rather than developing in-depth discussion on the key strands of APIs or bringing examples of the affordances and limitations of specific social media APIs, I take a close look at the growth of web APIs over the past years as a form of providing a historical register and also to observe both trends and changes of APIs.
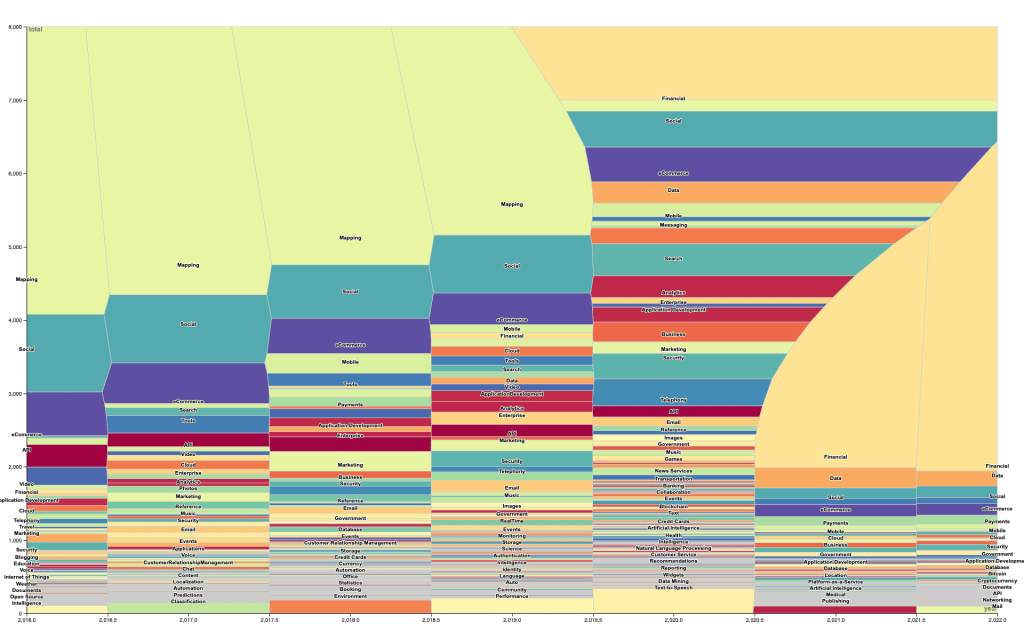
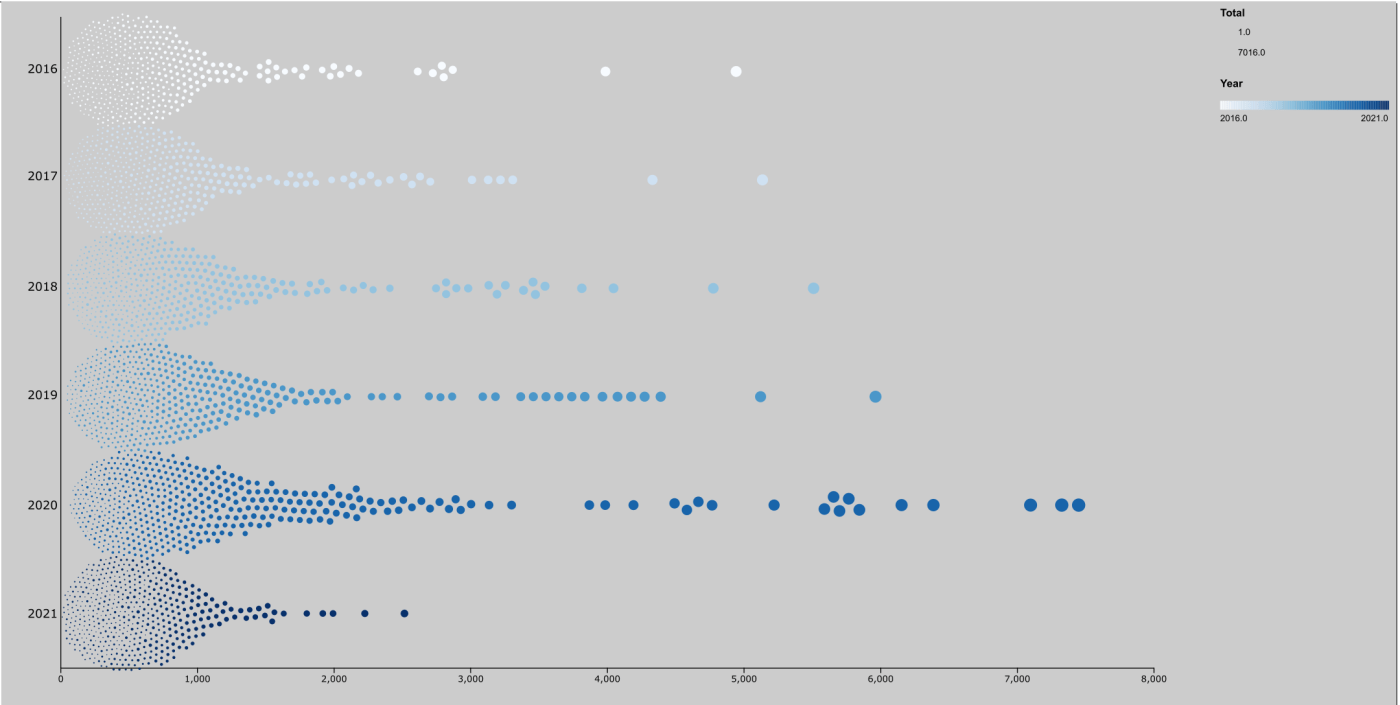
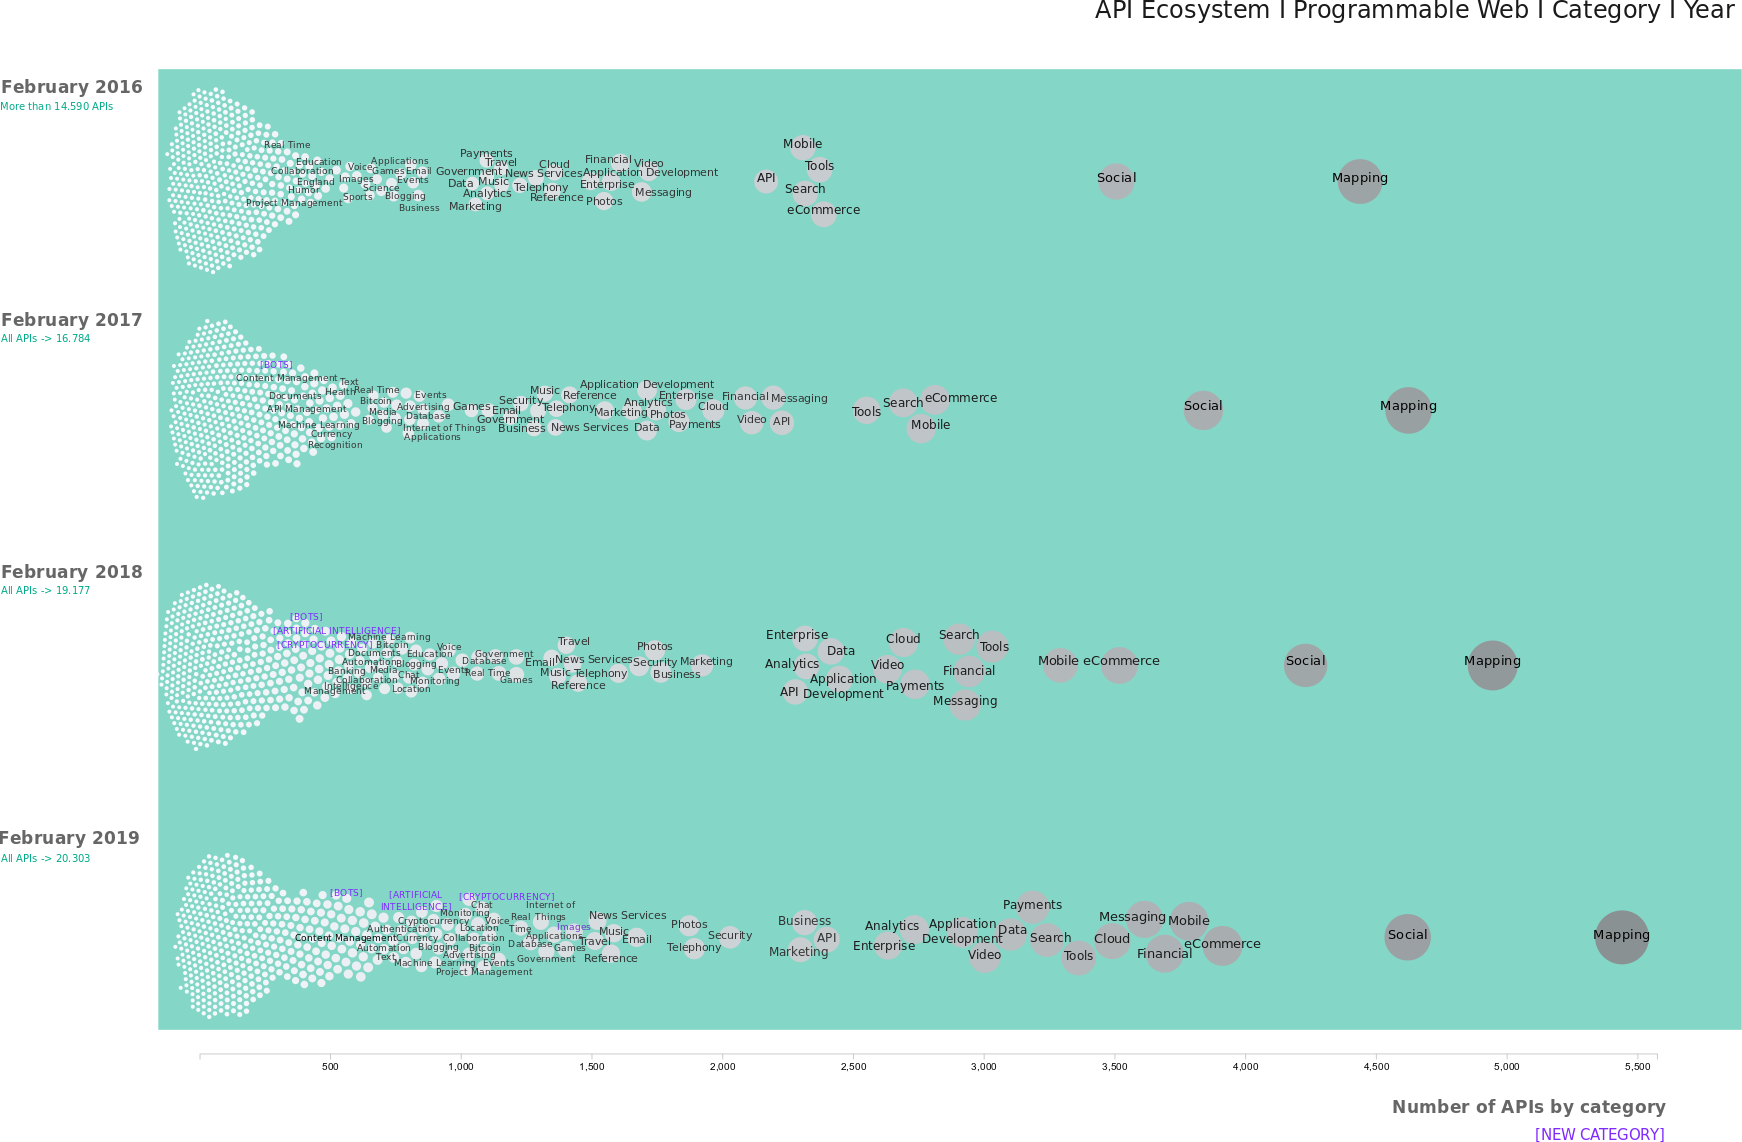
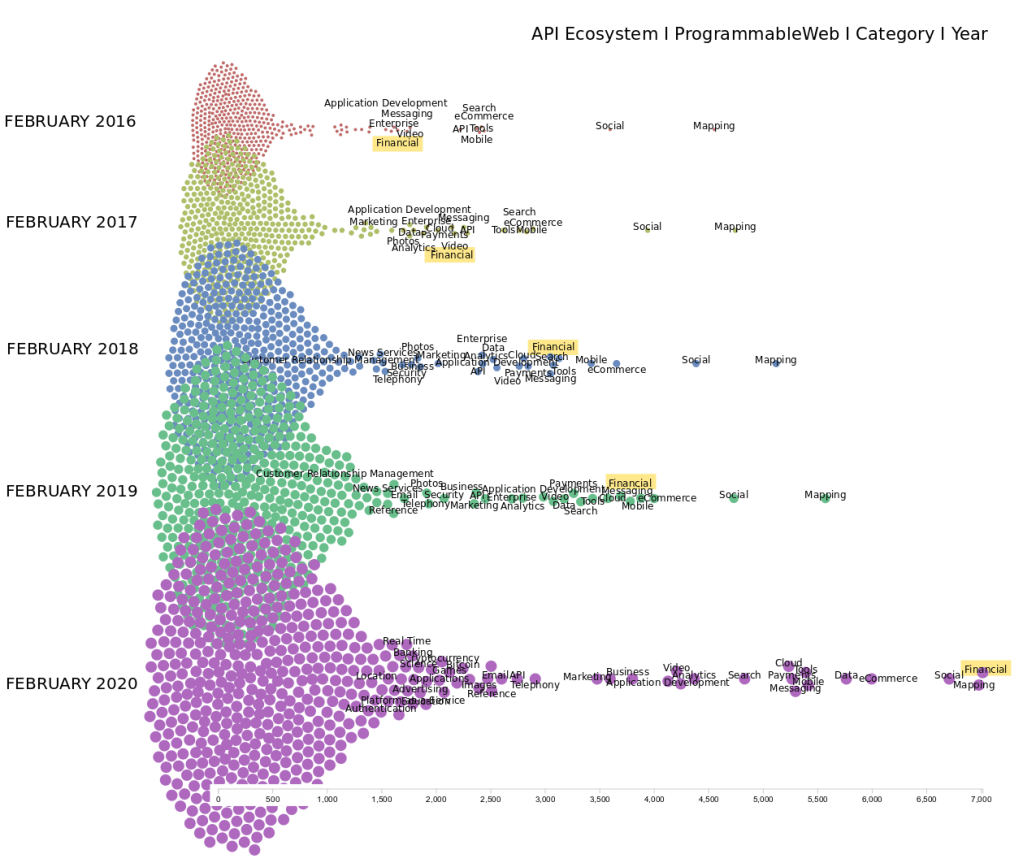
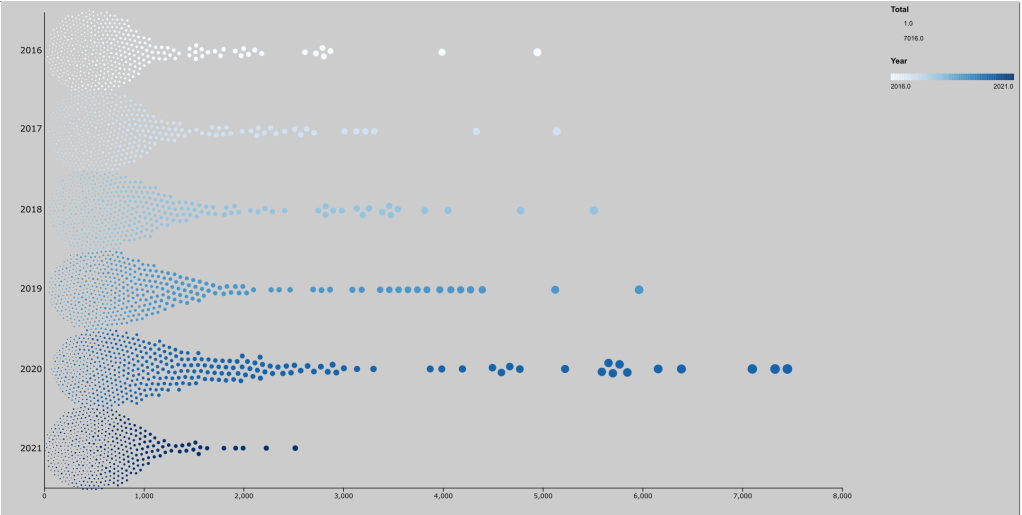
Since February 2016 I have been annually collecting the registered APIs categories from the largest API directory on the web made available by ProgrammableWeb.com. This work can be summarised in the following visualisations. Below you see the growth of APIs over the years and organised by categories. ProgrammableWeb.com organises APIs in different categories (nodes), and the node size corresponds to the total number of APIs in a given category. mapping and social are still leading the business. Note how web APIs have grown in number over years, especially between the years 2016 and 2018: more than 14.590 APIs were part of ProgramableWeb’s API directory in 2016; 16.784 in 2017; and 19.177 in 2018. This growth can be seen in the chart bellow, where we verify the emergence and establishment of categories such as e-commerce, mobile, messaging, cloud, tool, search and payments, at the same time we observe the expansion of new APIs categories. For instance, the appearance of bots category in 2017 and, in 2018, artificial intelligence and cryptocurrency – this latter had an impressive growth between 2018-2019.
I was very curious to know what APIs categories have gained a more prominent role over the years and, of course, what categories have lose their position in the rank. Yep, what you see below is a photography of the printed data viz afforded by RankFlow (a digital version would have demanded of me much much more time). blogging, database, transportation, voice and visualization faced a considerable decrease over the period analysed. Another example is also the case of humor, real state and recommendations. Nevertheless, I thought more tempted to spend more time in detecting the categories that have expanded overtime.
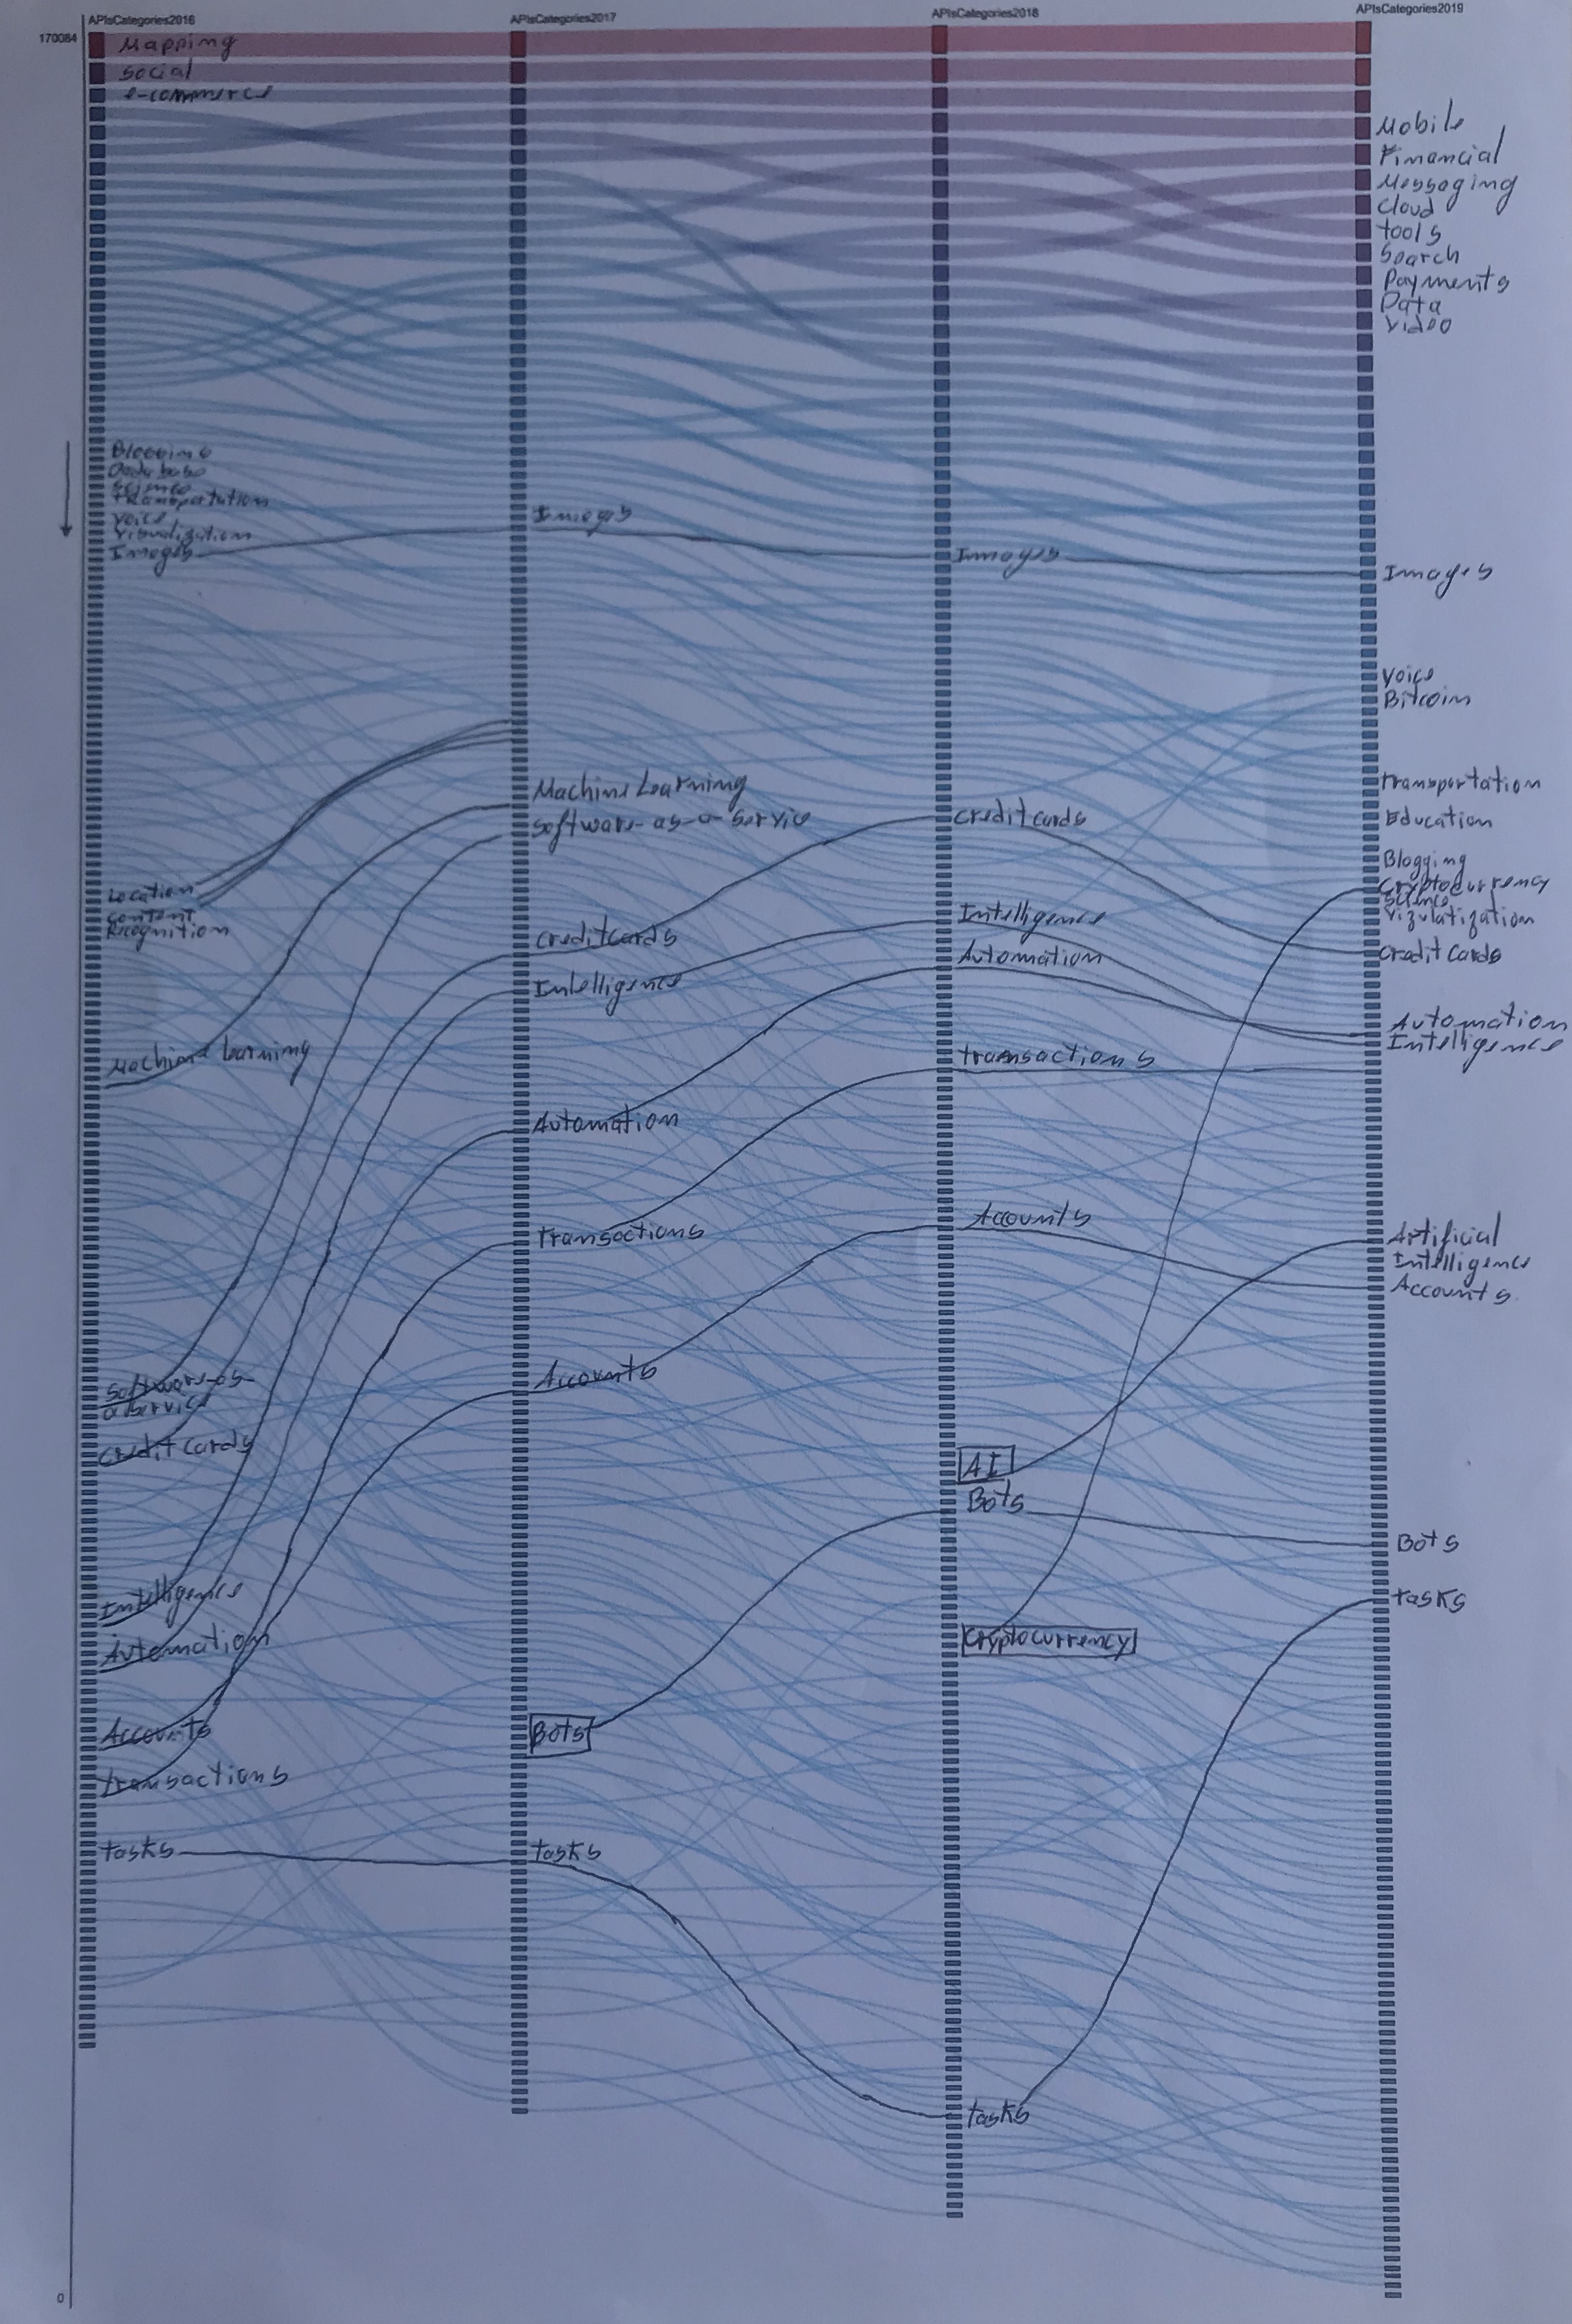
In 2018 the than new API category cryptocurrency had 293 apis registered, in February 2019 this number grew to 902. artificial intelligence is another category that deserves our attention, with 358 APIs in 2018 and 577 this year. Now if we look the API categories over the past three years, we can observe a group of APIs with continuous growth – namely credit cards (845), intelligence (689), automation (703), transactions (662), and accounts (545). The numbers in brackets reflects the year of 2019. tasks was another category that called my attention due to its development between 2018 and 2019. In the same vein, I also noticed the sharp growth of software-as-a-service followed by the expansion of machine learning between the years of 2016 and 2017.
This short post with brief notes and register on the web APIs ecosystem are not arbitrary. Some of the API categories has not only occupied a prominent position in our everyday digital life, but they have taken part in the public debate. As mentioned before, this post aimed to provide a historical register on the growth of web APIs over the years, being also a path to observe both trends and changes of APIs categories. Further analysis is to be done, suggestions and critique are always welcome!
++++++++++++++++++++++++++++++++++++++++++++++++++++++++++++++++
[updating the growth of Web APIs over the years, 21 March 2020]
I have just one note about observing the growth of web APIs through “the largest API directory on the web” made available byProgrammableWeb.com: financial is now at the top!
++++++++++++++++++++++++++++++++++++++++++++++++++++++++++++++++
[updating the growth of Web APIs over the years, 13 February 2021]
This year, to my surprise, I have found out that something changed in ProgrammableWeb API repository: the total number of APIs per categories have abruptly lowered. That means, either they are still updating the repository or something is going wrong. As you can see below, in February 2021, the total number of APIs per category (nodes) is not greater than 3.000 APIs.
What I can tell is that over the past five years, according to the largest API directory on the web, the number of existing web based APIs as well as APIs categories (e.g. mapping, social, financial, data) continuous to grow year after year (as you see below).
| APIs categories by ProgrammableWeb repository | ||
| year | total n. of APIs | total n. of categories |
| Feb 2016 | 14,590 | 473 |
| Feb 2017 | 16,784 | 476 |
| Feb 2018 | 19,177 | 482 |
| Feb 2019 | 20,303 | 482 |
| Feb 2020 | 22,492 | 489 |
| Feb 2021 | 23,960 | 505 |
Now, to better understand this discrepancy, the screenshot of the rankflow below will definitely help us with that task (please disregard the error in the first 6 categories in 2019). In 2021, for instance, the total number of APIs part of the financial category is 2.126, while in 2020, it is 7.016. Can anyone explain to me what is going on here? Such a drastic change has caught my attention to question how reliable are the API Directory of ProgrammableWeb.
Well, despite that, we see that the financial category is still at the top, reuniting the largest number of web APIs and followed by data, social, tools and eCommerce categories which is a major change comparing to 2020 rank. In this year, the mapping and social categories were still at the top positions.
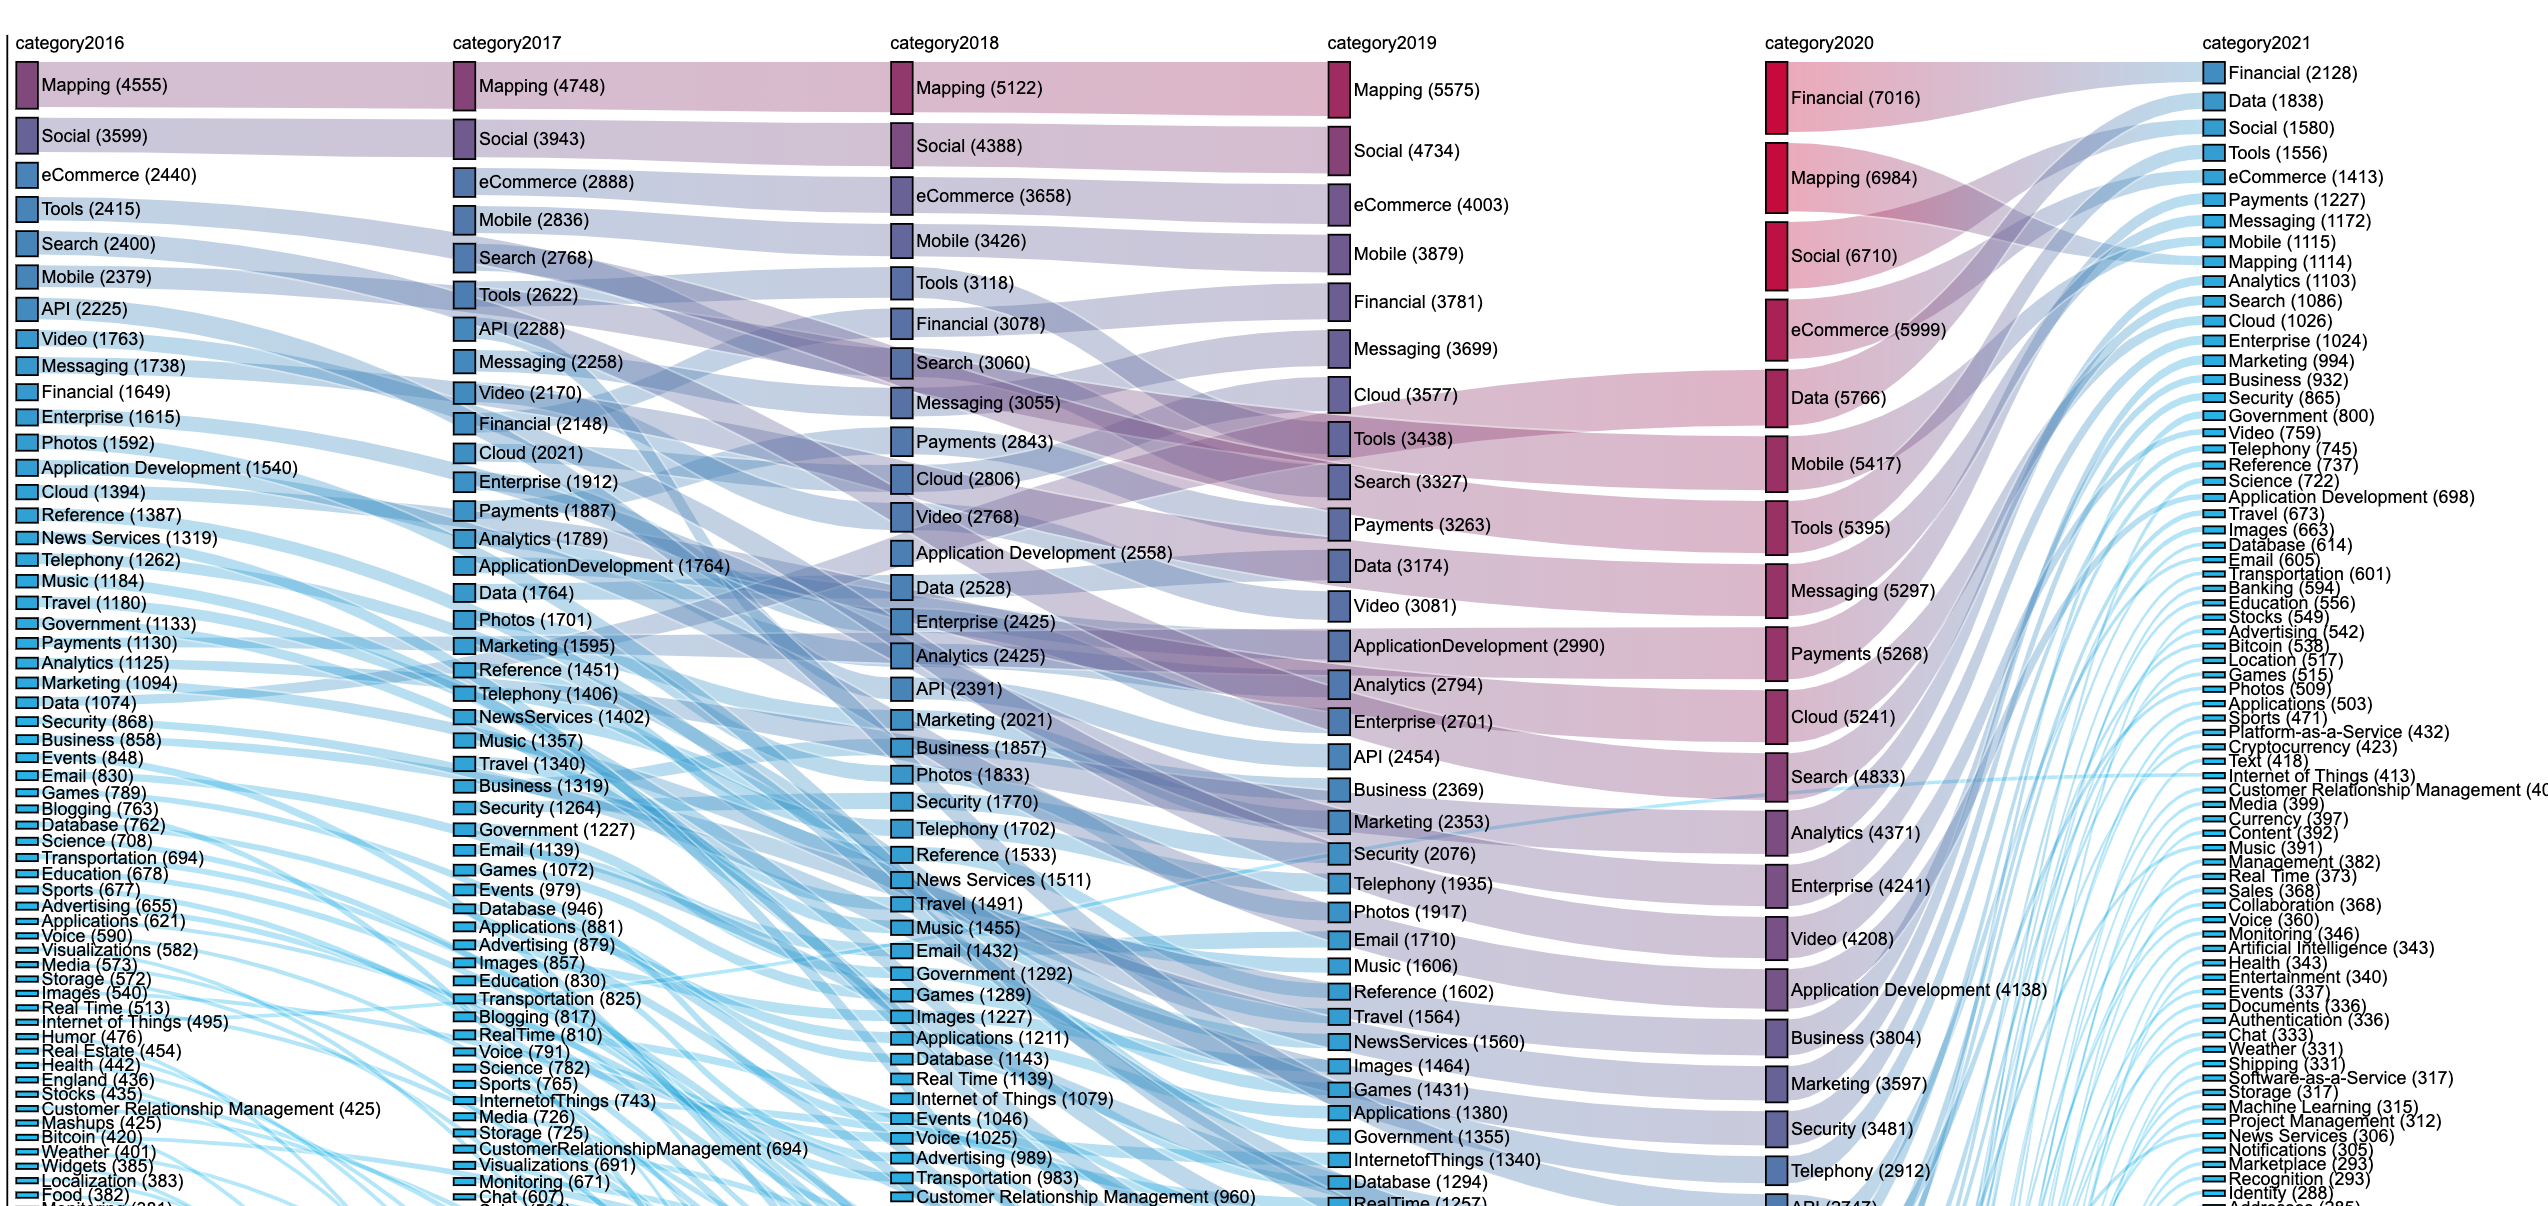
What APIs categories have gained a more prominent role over the years? [Visualization afforded by RankFlow and Inkscape]
++++++++++++++++++++++++++++++++++++++++++++++++++++++++++++++++
[updating the growth of Web APIs over the years, 10 March 2022]